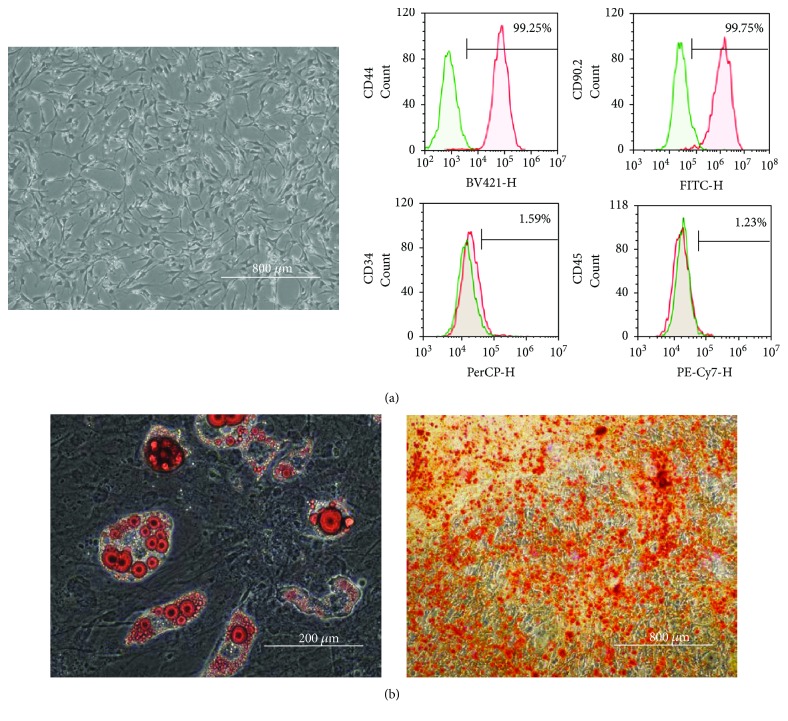
Figure 2.
Phenotype and differentiation potential of ADSCs isolated without preservation, which served as control group. Morphological appearance of ADSCs (passage 2) (a, left panel) and cell surface markers of ADSCs by flow cytometry (passage 2) (a, right panel). Representative images of adipocyte (b, left panel) and osteocyte differentiation (b, right panel) from mouse ADSCs (passage 2) cultured in differentiation medium.

