Figure 3.
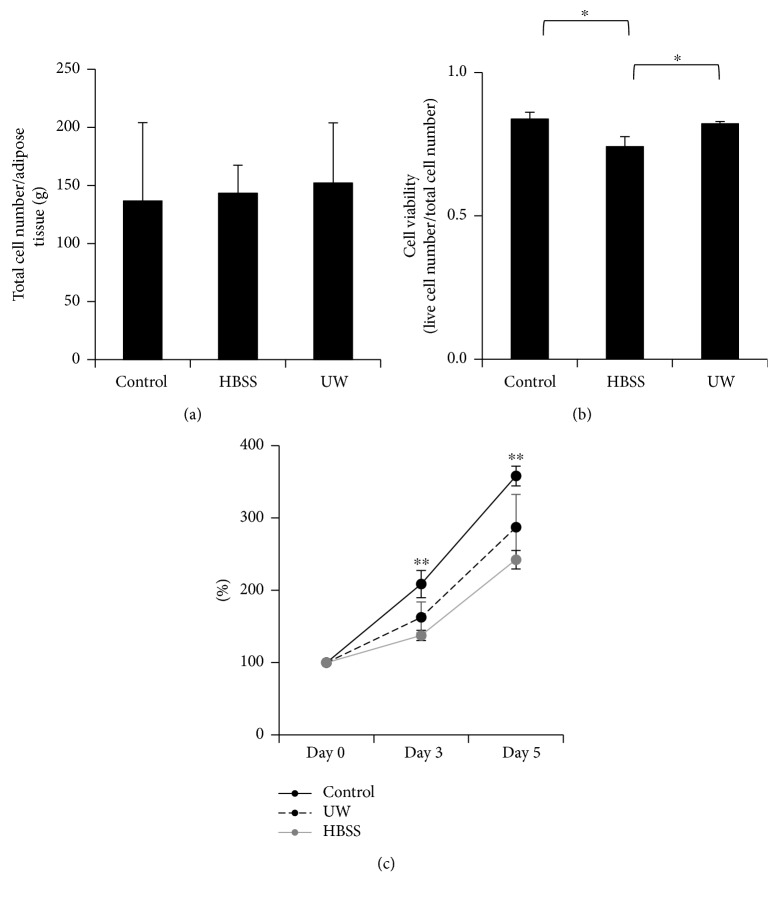
Total cell number and cell viability of ADSCs after preservation for 16 h in Hank's balanced salt solution (HBSS) or University of Wisconsin (UW) solution. Graphical representation of the total number of cells yielded from 1 gram of mouse adipose tissue after overnight preservation in UW and HBSS. ADSCs isolated without preservation served as control group (a). Cellular viability was determined by counting the number of live cells (not stained with 0.4% w/v Trypan blue solution) under a microscope. The decrease in cell viability of the HBSS group compared with both the control and UW groups was significant. Data are expressed as the mean ± SE (control group: 0.83 ± 0.03, HBSS group: 0.74 ± 0.03; ∗ P < 0.05. UW solution group: 0.82 ± 0.01; ∗ P < 0.05, n = 3) (b). Cell proliferation rate in the HBSS group on days 3 and 5 was significantly lower than that of the control group. Data are mean ± SE. The relative value is shown with the number of cells on day 0 as 100%. Day 0 (control group: 100.0 ± 0.0, UW group: 100.0 ± 0.0, HBSS group: 100.0 ± 0.0, n = 5). Day 3 (control group: 208.5 ± 18.9, UW group: 162.5 ± 21.2, HBSS group: 137.5 ± 7.1; ∗∗ P < 0.01, n = 5). Day 5 (control group: 358.0 ± 13.7, UW group: 287.0 ± 45.4, HBSS group: 242.3 ± 12.9; ∗∗ P < 0.01, n = 5) (c).

