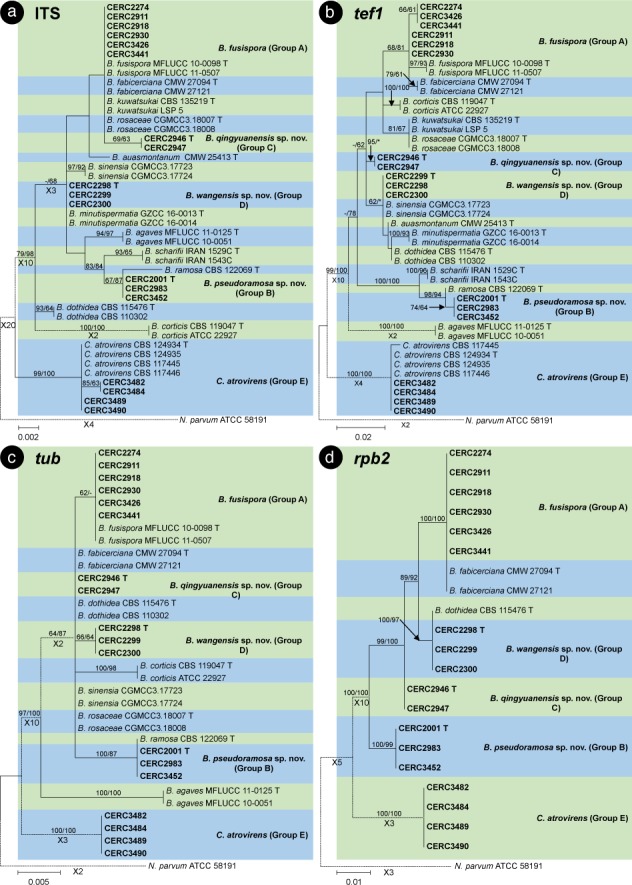
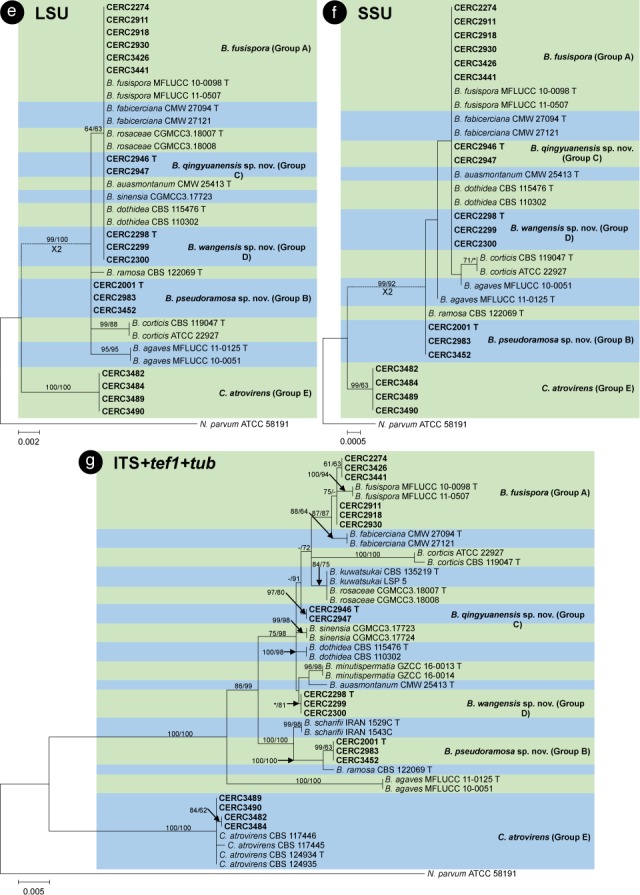
Fig. 2.


Phylogenetic trees based on maximum likelihood (ML) analyses for species in Botryosphaeria and Cophinforma. a. ITS region; b. tef1 gene region; c. tub gene region; d. rpb2 gene region; e. LSU region; f. SSU region; g. combination of ITS, tef1 and tub regions. Isolates sequenced in this study are in bold. Bootstrap support values ≥ 60 % for ML and MP are presented above branches as follows: ML/MP, bootstrap support values < 60 % are marked with ‘–’, and absent (< 50 %) are marked with ‘*’. Isolates representing ex-type sequences are marked with ‘T’. Neofusicoccum parvum (ATCC 58191) was used as the outgroup taxon.
