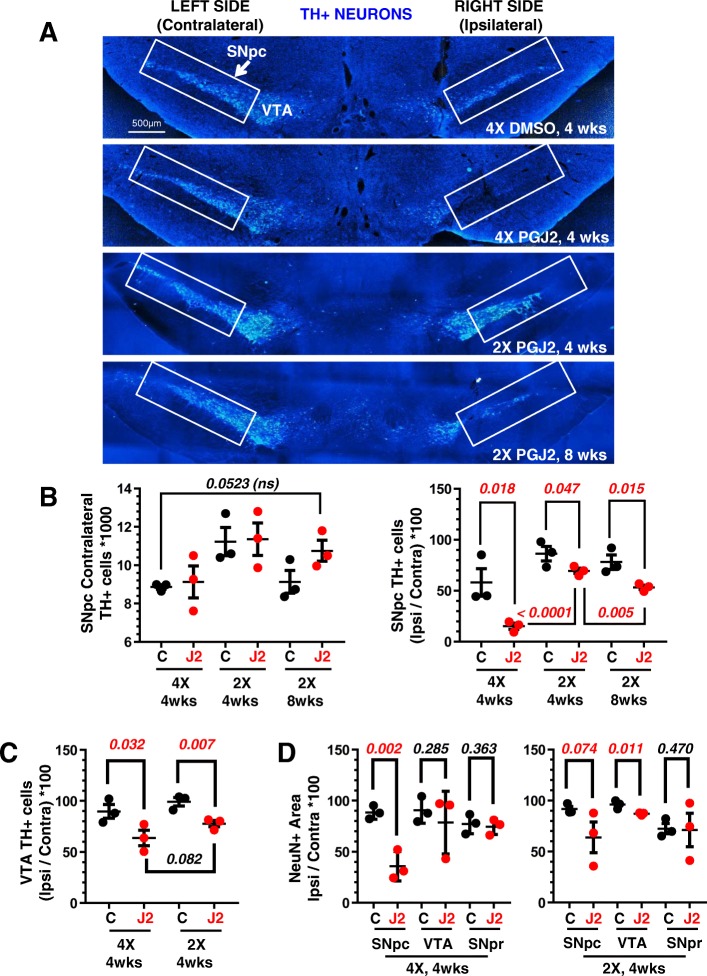
Fig. 2.
Progressive dopaminergic neuronal loss in the SNpc upon successive intranigral PGJ2 microinjections. a Representative coronal sections of the ventral midbrain depicting dopaminergic neurons. TH-immunoreactivity was strong in the VTA and SNpc (rectangle) of control (DMSO) rats. TH-immunoreactivity decreased in the ipsilateral SNpc of rats receiving two (2X) or four (4X) PGJ2 injections. Dopaminergic neurons in the VTA were less affected. Scale bar = 500 μm. b The extent of PGJ2-induced damage was assessed by calculating the total number of TH+ neurons (mean ± SEM) in the SNpc using unbiased stereology as described in Materials and Methods. No significant differences in TH+ neurons were observed in the contralateral SNpc of the different groups of rats. TH+-immunoreactivity decreased in a gradual manner in the ipsilateral SNpc of rats receiving two (2X) or four (4X) PGJ2 injections and at 4 weeks or 8 weeks post-injections of two (2X) PGJ2 injections. c PGJ2-induced damage in the VTA was measured by TH+ area (mean ± SEM). Dopaminergic neurons in the VTA were less affected than in the SNpc. d Neuronal loss in the SNpc, VTA, and SNpr were compared by NeuN+ area (mean ± SEM). NeuN-immunoreactivity decreased significantly in the SNpc, but less in the VTA and not significantly in the SNpr of PGJ2-injected rats compared to controls (DMSO-treated). Black circles, control, DMSO-treated rats; red circles, PGJ2-treated rats. Statistical significance was estimated with one-way ANOVA (b, left), and the Student’s T test (b, right, c and d) to compare DMSO and PGJ2-treated groups and between two PGJ2-treated groups. The p values in red indicate statistical significant (< 0.05) difference from DMSO-injected rats. N = 3 rats per group. X = number of injections (once per week)

