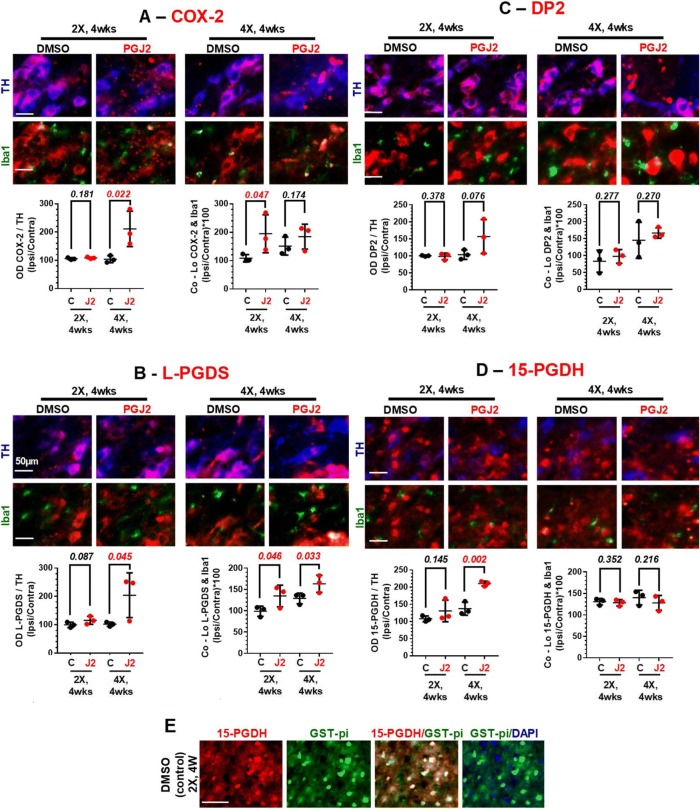
Fig. 7.
Effects of successive PGJ2 microinfusions on the following factors of the PGD2/J2 prostaglandin pathway: COX-2 (a), L-PGDS (b), DP2 receptor (c), and 15-PGDH (d), all in dopaminergic neurons and microglia, and 15-PGDH also in oligodendrocytes (e). Immunostaining for COX-2 (red in a), L-PGDS (red in b), DP2 (red in c), 15-PGDH (red in d and e), TH+ neurons (blue in a–d), Iba1+ microglia (green in a–d), and GST-pi+ oligodendrocytes (green in e) at 4 weeks after two (2X) and four (4X) PGJ2 microinjections. Scale bar = 50 μm. a COX-2 is significantly increased in dopaminergic neurons from rats receiving four (4X) PGJ2 injections compared to controls. Co-localization of COX-2 and Iba1 is greater in microglia from rats receiving two (2X) PGJ2 injections than in controls. b L-PGDS is significantly increased in dopaminergic neurons from rats receiving four (4X) PGJ2 injections than in controls. Co-localization of L-PGDS and Iba1 is greater in microglia from rats receiving two (2X) and four (4X) PGJ2 injections than in controls. c DP2 levels remain stable in dopaminergic neurons from all treatment groups, but DP2+ staining is almost absent in microglia. d 15-PGDH expression is increased in dopaminergic neurons from rats receiving four (4X) PGJ2 injections, but not in microglia. e 15-PGDH is highly expressed in SNpc oligodendrocytes from all groups of rats. Values on the y-axis represent the optical density (OD, normalized to TH, left graphs), or co-localization (normalized to Iba1, right graphs) ratios between ipsilateral SNpc over the contralateral. Black circles, control, DMSO-treated rats; red circles, PGJ2-treated rats. Statistical significance was estimated with Student’s T test to compare DMSO and PGJ2-treated groups. The p value in red indicates significant (p < 0.05) difference from DMSO-injected rats. N = 3 rats per group. X = number of injections (once per week)

