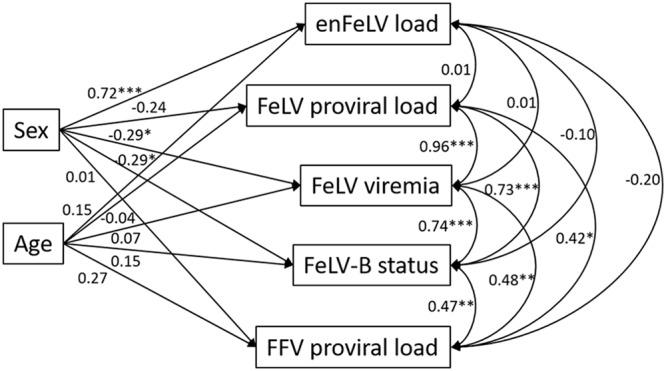
FIG 2.

Structural equation model reveals FeLV associations with demographic factors and coinfection. FeLV variables covary with one another (curved double-headed arrows) and FFV proviral load (FFV is the only pathogen to covary with FeLV variables; see Table 3) and are predicted (single-headed arrows) by cat sex and age. Values represent standardized coefficients and are thus comparable in their relative-effect sizes (importance). Positive values associated with sex indicate higher response variable values for males, and negative coefficients indicate higher response variable values for females. *, P < 0.05; **, P < 0.01; ***, P < 0.001. All FeLV and FFV variables are log10 transformed, except FeLV-B status. Values for variation (r2) are as follows: enFeLV load, 0.55; FeLV proviral load, 0.06; FeLV viremia, 0.09; FeLV status, 0.10; FFV proviral load, 0.07.
