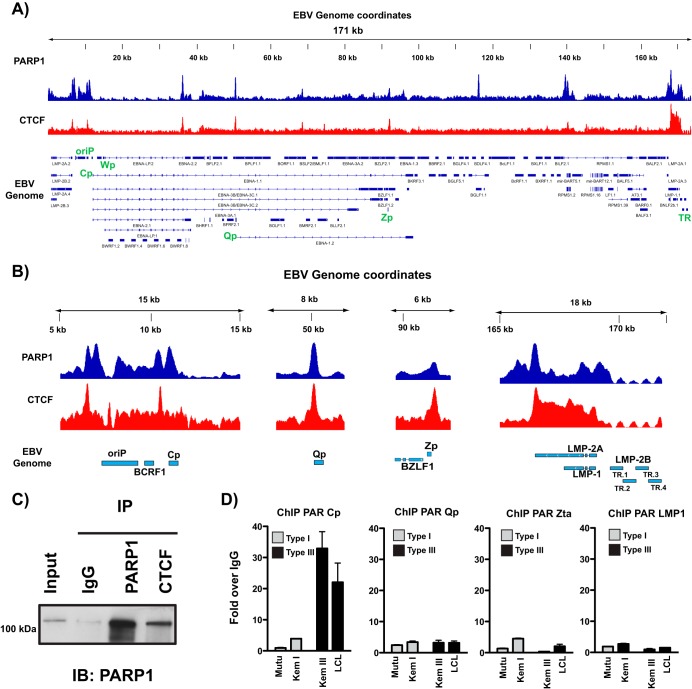
FIG 2.
PARP1 colocalizes with CTCF across the Epstein-Barr virus genome. (A) ChIP-seq for PARP1 and CTCF across the EBV genome in LCLs demonstrating widespread colocalization. Peaks are expressed as counts per million reads. Corresponding genes in the linearized EBV genome are shown below. (B) Zoomed images of PARP1 and CTCF ChIP-seq at Cp, Qp, Zp, and LMP1/2 loci. Peaks are shown as counts per million reads. Scale in the y axes are independent among the loci shown. (C) Western blot showing PARP1 and CTCF interaction in LCLs. Cell lysates were subjected to immunoprecipitation with antibodies for IgG, PARP1, and CTCF. Immune complexes were resolved by gel electrophoresis and immunoblotted for PARP1. (D) ChIP-qPCR for poly(ADP-ribose) moieties at Cp, Qp, Zp, and LMP1 in representative type I (white bars; Mutu, Kem I) and type III (black bars; Kem III, LCL) latent cell lines. qPCR data are presented as fold above the level for IgG. Results are representative of three independent experiments and show means ± standard deviations.

