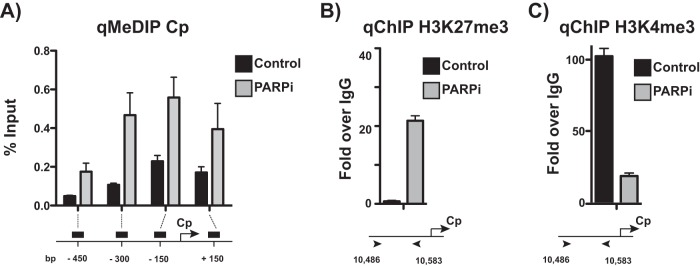
FIG 5.
Active chromatin landscape at the Cp promoter is repressed after PARP inhibition. (A) Methylated DNA immunoprecipitation (MeDIP) qPCR at the Cp promoter in untreated and olaparib-treated (PARPi) LCLs. qPCR data are presented as percentages of input DNA. Results are representative of three independent experiments and show means ± standard deviations. (B) ChIP-qPCR for the repressive H3K27me3 mark at Cp in untreated and olaparib-treated (PARPi) LCLs. qPCR data are presented as fold above the level for IgG. Results are representative of three independent experiments and show means ± standard deviations. (C) ChIP-qPCR for the active H3K4me3 mark at Cp in untreated and olaparib-treated (PARPi) LCLs. qPCR data are presented as fold above the level for IgG. Results are representative of three independent experiments and show means ± standard deviations.

