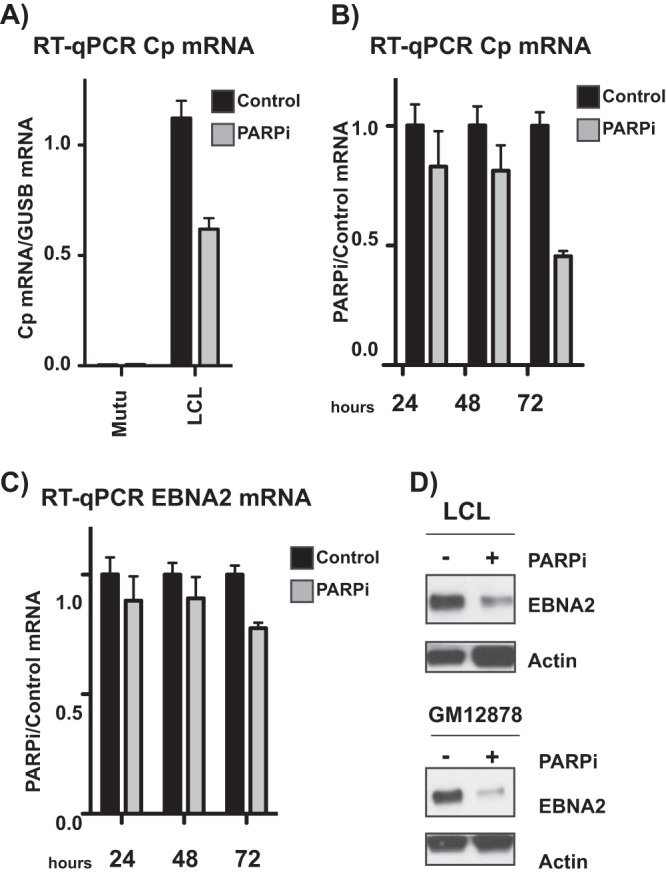
FIG 6.

PARP inhibition alters the Epstein-Barr virus latency phenotype, reflecting a transition to type I latency. (A) qRT-PCR showing relative expression of Cp transcripts in untreated and olaparib-treated type I Mutu (negative control) and type III latent LCL cell lines. Expression is relative to that of the abundant B cell transcript GUSB. Graph is representative of three independent experiments and shows means ± standard deviations. (B) qRT-PCR showing relative expression of Cp transcripts in LCLs. PARPi cells were treated with olaparib for 24, 48, or 72 h, as indicated. Expression is shown relative to untreated levels. Results are representative of three independent experiments and show means ± standard deviations. (C) qRT-PCR showing relative expression of EBNA2 transcripts in LCLs. PARPi cells were treated with olaparib for 24, 48, or 72 h, as indicated. Expression is shown relative to untreated levels. Results are representative of three independent experiments and show means ± standard deviations. (D) Western blot for EBNA2 protein in two different type III latent lymphoblastoid cell lines treated with olaparib (PARPi). Actin served as a cellular loading control.
