FIG 5.
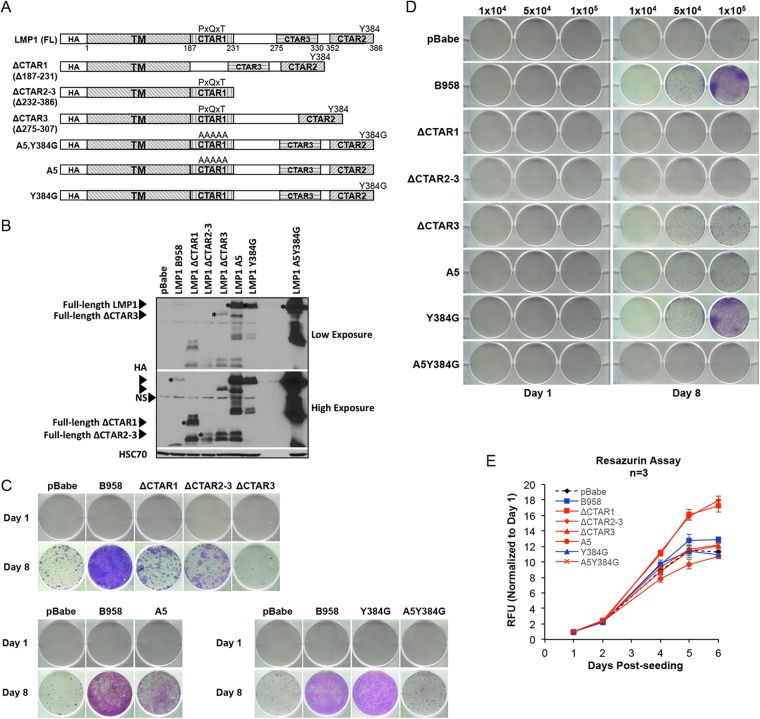
Three conserved signaling domains and the PXQXT motif are critical for outgrowth potential. (A) Schematic representation of LMP1 signaling mutants. (B) Immunoblot analysis of HA-tagged LMP1 signaling mutants. The asterisks indicate the full-length protein for each mutant. NS, nonspecific band produced by HA antibody. HSC70 was used as a loading control. (C) Crystal violet staining to assess the outgrowth of HK1 cell lines expressing LMP1 signaling mutants 1 and 8 days after recovery from anoikis. The day 8 images represent one of three independent experiments. (D) Crystal violet staining at 1 and 8 days of outgrowth for LMP1 signaling mutants following induction of anoikis. Specific numbers of viable cells (1 × 10⁴, 5 × 10⁴, and 1 × 10⁵) were seeded per well for assessment of outgrowth potential as indicated above the wells. (E) Analysis of growth kinetics by resazurin assay for LMP1 mutants on tissue culture-treated dishes. The dashed black line indicates the HK1 pBabe control, the blue lines represent LMP1 mutants that recover following induction of anoikis (B958 and Y384G), and the red lines represent LMP1 mutants that do not recover (ΔCTAR1, ΔCTAR2-3, ΔCTAR3, A5, and A5Y384G). The RFU and standard deviations were determined from 3 biological replicates.

