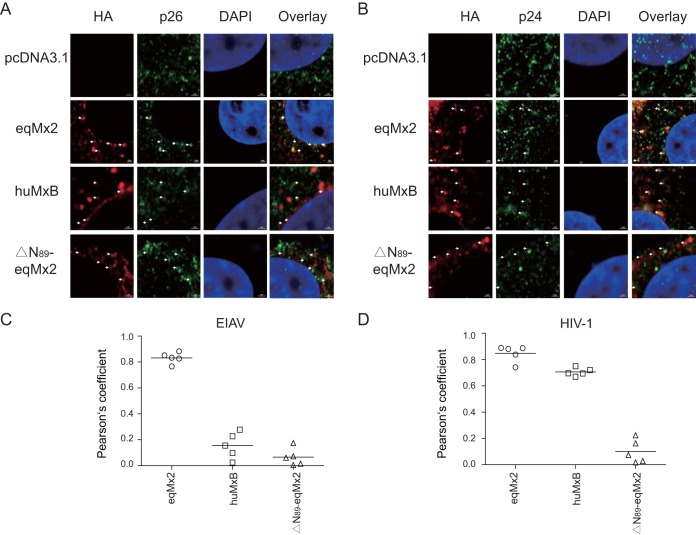
FIG 9.
(A) Colocalization of eqMx2 and the EIAV capsid protein. An expanded segment of an optical section of the colocalization between the viral capsid and certain Mx2s is shown. The cells were stained with an anti-HA antibody (TRITC) (red) or an anti-p26 antibody (FITC) (green), and nuclei were stained with DAPI (blue). These cells were examined by confocal microscopy. (B) Same as panel A, except that in this experiment, the cells were challenged with HIV-1 and stained with p24 antibody. This experiment was performed three times, and representative results are shown. (C) Pearson correlation coefficient values for the colocalization of EIAV capsid protein p26 and certain Mx proteins. Symbols signify the Pearson correlation coefficient for the corresponding spots marked by arrows in panel A. (D) Pearson correlation coefficient values for the colocalization of HIV-1 capsid protein p24 and certain Mx proteins. Symbols signify the Pearson correlation coefficient for the corresponding spots marked by arrows in panel B.

