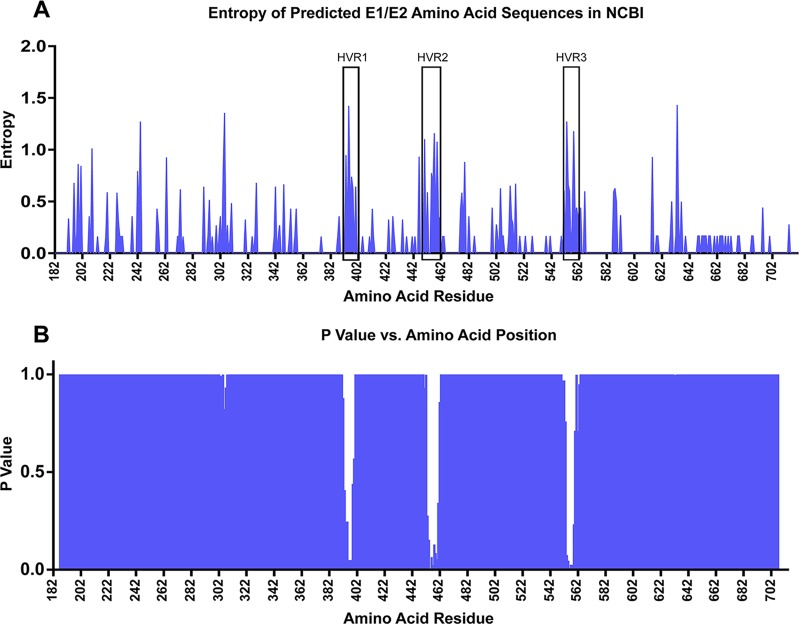
FIG 11.
Entropy of predicted amino acid residues for all hepacivirus A E1/E2 sequences entered in the NCBI database (A) and mean entropy comparison of 10-aa overlapping sliding windows (B). (A) Blue lines indicate the Shannon entropy calculated at each amino acid residue. Hypervariable regions 1 to 3 HVR1 to HVR3 are boxed. (B) The mean entropy within each 10-aa sliding window was compared to the average mean entropy for all 10-aa windows spanning E1/E2. The graph depicts the P values determined by one-way ANOVA, with Dunnett's multiple-comparison test.

