
FIG 3.
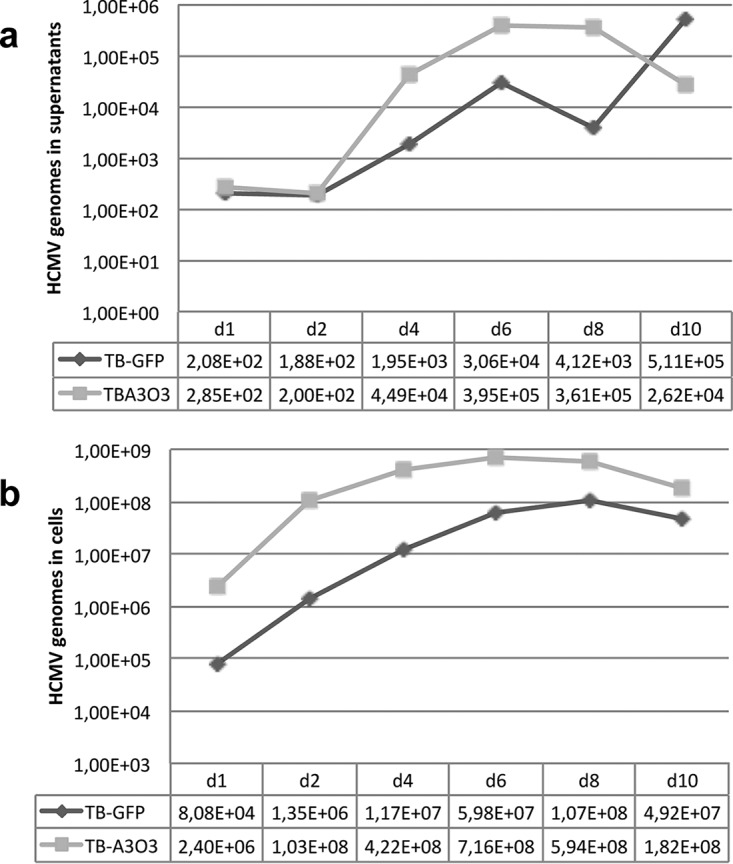
Replication curves of TB40-GFP or TB40-ANCHOR3 viruses in MRC5-infected cells. (a) Titration of HCMV genomes in the supernatants of MRC5-infected cells. (b) Titration of HCMV genomes in MRC5-infected cells. The measured values are given at the bottom of each graph and represent the total number of HCMV genomes in supernatants (a) or in cells (b).