
FIG 6.
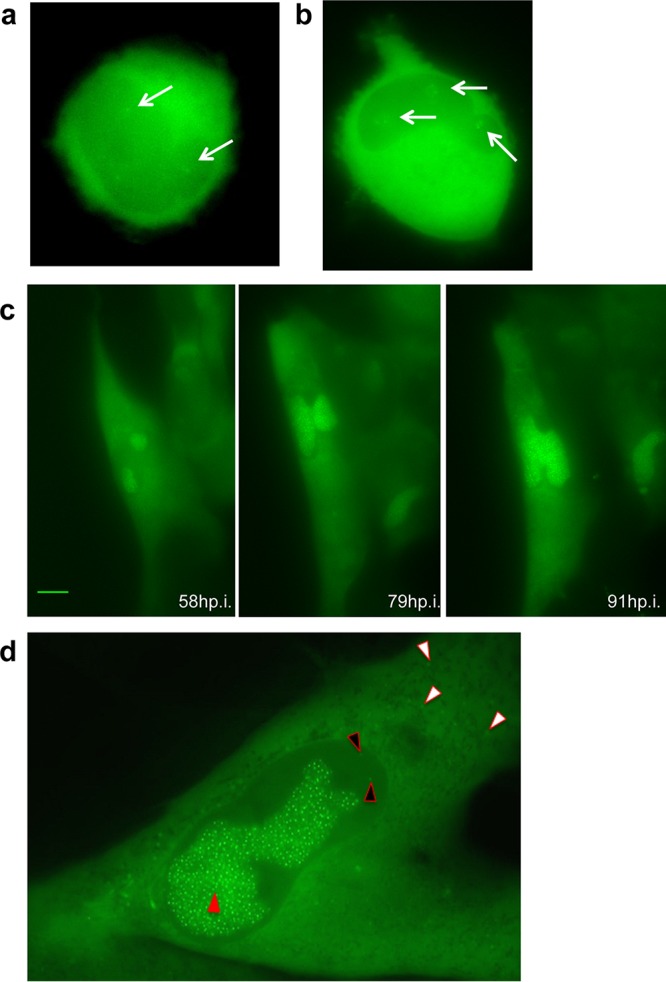
Visualization of ANCHOR-HCMV infection steps in living cells. MRC5 cells were infected with TB40-ANCHOR3 HCMVs at an MOI of 0.5. (a) About 16 or 17 h p.i., a few very faint spots appeared in infected cells, which possibly corresponded to incoming viral genomes (arrows) (magnification, ×63). (b) Distinct areas suggestive of prereplicative sites developed around the initial spots, which multiplied, while these areas increased in size (arrows) (magnification, ×63). (c) Later in infection (around 70 to 80 h p.i.), the areas fused into a unique putative RC, which continued to grow (magnification, ×40; scale bar, 10 μm). (d) An infected MRC5 cell imaged 72 h p.i.; the nucleus contains a large RC with numerous bright spots (red arrowhead), while fainter spots are visible in the nucleus outside the RC (black arrowheads) and in the cytoplasm (white arrowheads) (magnification, ×63). All images were acquired with a wide-field Zeiss Axiovert Observer Z1 with a 1.4-NA 40× or 63× objective.