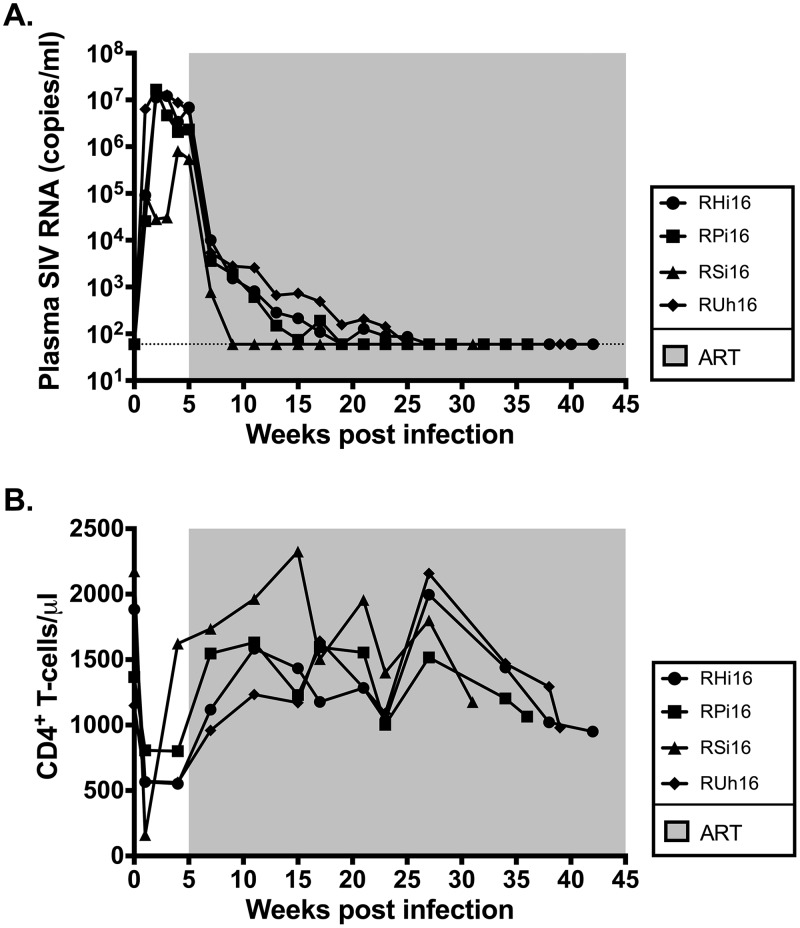
FIG 1.
SIV-infected infant RM virologic and immunologic response to ART. (A) Longitudinal analysis of plasma SIV RNA levels. The shaded area represents the period of ART treatment. The dotted line represents the limit of detection of the assay. (B) Longitudinal analysis of peripheral CD4+ T cell absolute counts. The shaded area represents the period of ART treatment.

