FIG 3.
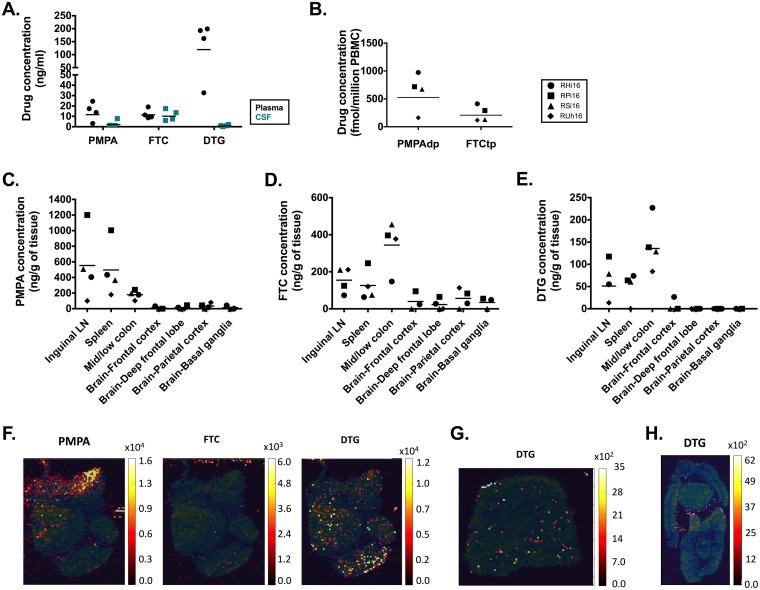
Antiretroviral drug levels in fluids and tissues of ART-treated SIV-infected RM infants. (A) Levels of PMPA, FTC, and DTG in the plasma and CSF. (B) Levels of phosphorylated metabolites of FTC and PMPA (FTCtp and PMPAdp) in PBMCs. (C, D, and E) Levels of PMPA (C), FTC (D), and DTG (E) in tissue measured by LS-MS/MS in the LN, spleen, colon, and brain. The horizontal lines represent medians. (F, G, and H) Representative IR-MALDESI images of ART distribution in lymph nodes (F), spleen (G), and colon (H). The distribution of the drugs is depicted using a color scale ranging from dark red for areas of low concentration to yellow for areas of high concentration. The maps are overlaid on the ion map for cholesterol (blue-green color scale).

