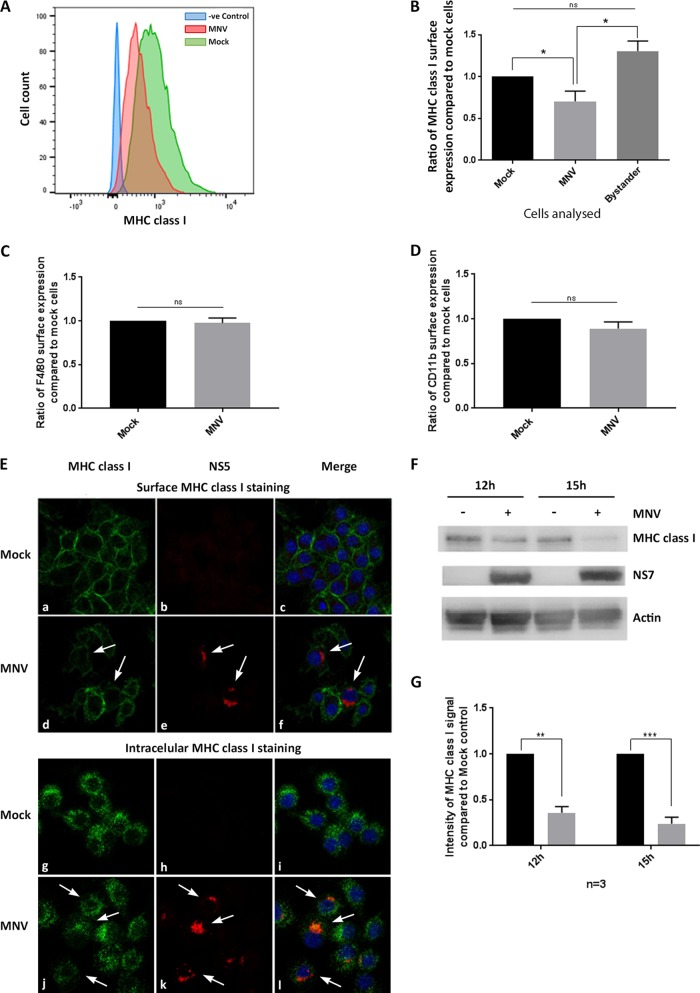
FIG 1.
MNV infection leads to reduced MHC class I protein levels and reduced surface expression of MHC class I proteins in mouse macrophages. RAW264.7 macrophages were either infected with MNV CW1 (MOI, 5) for 12 h or left untreated and were then stained with FITC-conjugated MHC class I-specific antibodies (H-2Kd/H-2Dd; Bio-Gems) on the cell surface and with antibodies to viral protein NS5 within the cell. MNV-infected cells were gated for the NS5-positive population. (A) Representative histogram of MHC class I surface expression in MNV-infected (red) and uninfected (green) cells. The blue area represents isotype control cells. (B) Ratios of the MFI of the MHC class I signals of MNV-infected and bystander (exposed to virus, but NS5 negative) cells to that of mock-treated cells (n = 4). (C) Ratio of the MFI of the F4/80 signal of MNV-infected RAW264.7 cells to that of mock-treated cells (n = 3). (D) Ratio of the MFI of the CD11b signal of MNV-infected DC2.4 cells to that of mock-treated cells (n = 3). (E) Immunofluorescence analyses of MNV-infected (d, e, f, j, k, and l) and mock-infected (a, b, c, g, h, and i) cells stained with MHC class I antibodies on the surface (a and d) or within the cells (g and j) or with NS5 antibodies within the cell (b, e, h, and k). DAPI served as the nuclear stain for the merged image (c, f, i, and l). Infected cells are indicated by white arrows. (F) Immunoblot analysis of MNV-infected or uninfected macrophages after 12 h and 15 h. Whole-lysate samples were probed with anti-actin, anti-NS7, and anti-MHC class I antibodies (n = 3). (G) Quantitation of MHC class I immunoblot intensity (F) in MNV-infected cell lysates (shaded bars) relative to that in uninfected controls (filled bars) at 12 and 15 hpi (n = 3). Data in all bar graphs are averages ± standard errors of the means. ns, P > 0.05; *, P < 0.05; **, P < 0.01; ***, P < 0.001.

