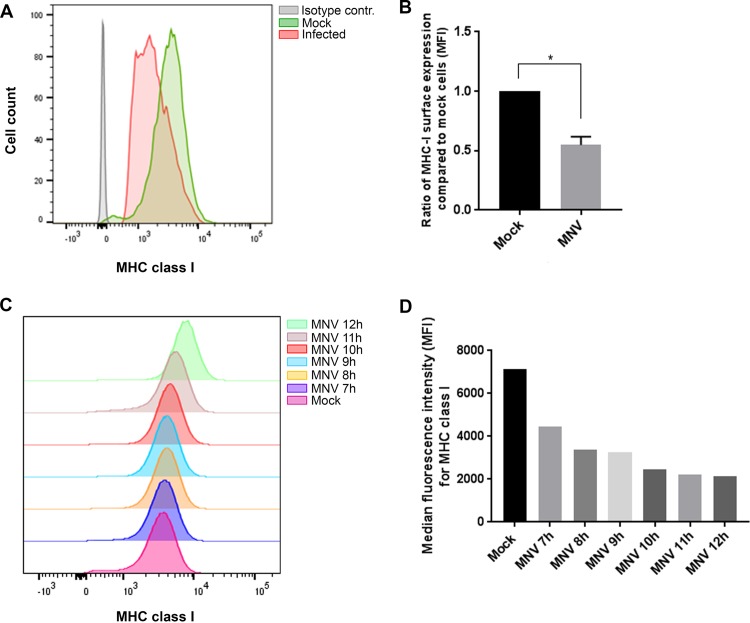
FIG 5.
MNV causes a decrease in MHC class I levels on the cell surface early during infection and in different cell types. DC 2.4 cells were either infected with MNV CW1 (MOI, 5) for 12 h or left uninfected and were analyzed for MHC class I expression on their surfaces and MNV NS5 within the cell. (A) Representative histogram of MHC class I signals (MHC class I Y3) in MNV-infected (red), uninfected (green), and isotype control (gray) cells. (B) Quantitative analysis of the median fluorescence intensities for MHC class I proteins in MNV-infected and uninfected cells. On average, DC 2.4 cells displayed an infection rate of 30 to 40%. (C) DC 2.4 cells were infected with MNV for 7, 8, 9, 10, 11, or 12 h before being stained with an anti-MHC class I antibody (Y3) on their surfaces. MNV-infected cells were identified via intracellular staining with NS4. Histograms depict MHC class I signals on the surfaces of MNV-infected cells at different times. (D) Median fluorescence intensities for the MHC class I signals in MNV-infected and mock-infected control cells.

