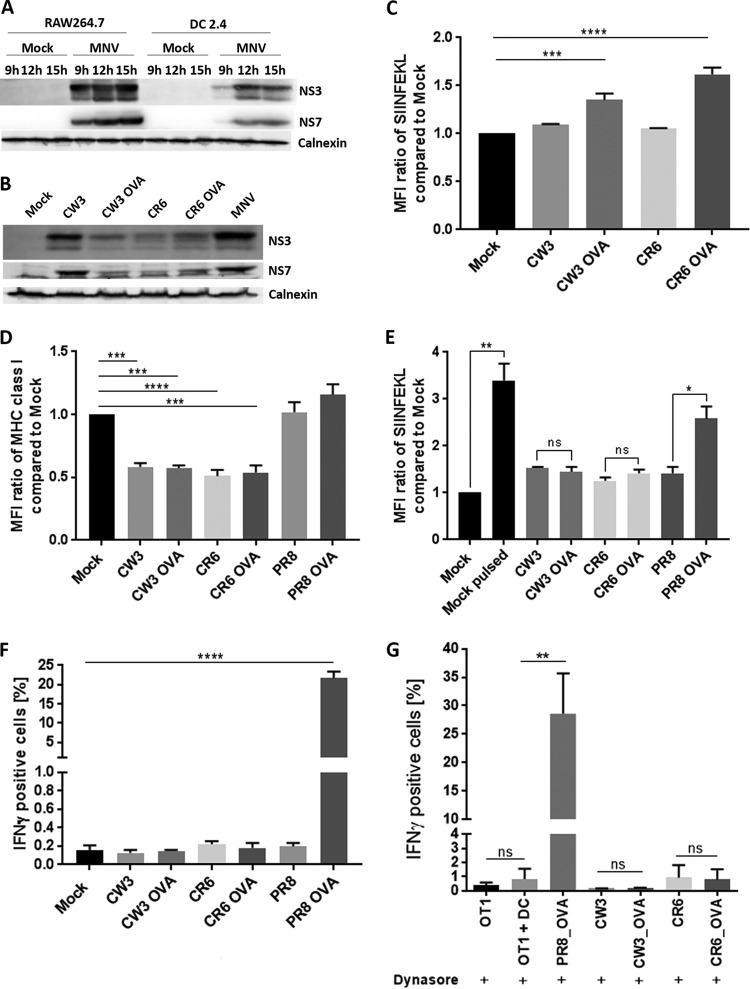
FIG 6.
The surface presentation of viral peptides and the activation of CD8+ T cells are suppressed in MNV-infected cells. (A) Comparative infection kinetics for MNV CW1-infected RAW264.7 and DC2.4 cells at 9 h, 12 h, and 15 h postinfection. Cell lysates were analyzed via immunoblot analysis with anti-NS3, anti-NS7, and anti-calnexin antibodies. (B) Immunoblot analysis of NS3 and NS7 expression in DC2.4 cells infected with CW3, CW3 OVA, CR6, CR6 OVA, or MNV (CW1). (C) DC2.4 cells either were infected with CW3, CW3 OVA, CR6, or CR6 OVA or were left uninfected. Cells were treated with dynasore (50 μM) at 1 hpi and were stained for SIINFEKL on their surfaces at 12 hpi. The MFI signals for SIINFEKL in infected cells were compared to that for uninfected cells. (D and E) DC 2.4 cells were infected with the acute CW3 strain or the persistent CR6 strain containing the OVA peptide as well as with the corresponding WT strains. As a control, cells either were infected with WT PR8 or PR8 OVA or were left uninfected. DC 2.4 cells were stained with an anti MHC class I (MHC class I M1/42) (D) or anti-SIINFEKL (E) antibody on their surfaces and with an anti-dsRNA antibody within the cells. Infected populations were identified via positive anti-dsRNA staining and were analyzed for their MHC class I and SIINFEKL signals (median fluorescence intensity) via flow cytometry. (F) DC 2.4 cells were exposed to in vitro-activated OT-I-GFP CD8+ T cells and were incubated for 6 h at 37°C in the presence of BFA and monensin. Cells were fixed, stained for IFN-γ within the cells, and analyzed via flow cytometry. The percentage of IFN-γ-positive cells in the OT-I-GFP population (GFP positive) was calculated. n, 3 for all analyses. (G) DC 2.4 cells either were infected with WT CW3, WT CR6, CW3 OVA, CR6 OVA, or PR8 OVA or were left uninfected. Cells were treated with dynasore (50 μM) at 1 hpi and were exposed to OT-I cells for 6 h at 37°C. OT-I activation was analyzed via intracellular IFN-γ staining (n, 4 for all conditions except WT CR6 and CR6 OVA [n = 2]). Data are averages ± standard errors of the means. ns, P > 0.05; *, P < 0.05; **, P < 0.01, ***, P < 0.001; ****, P < 0.0001.

