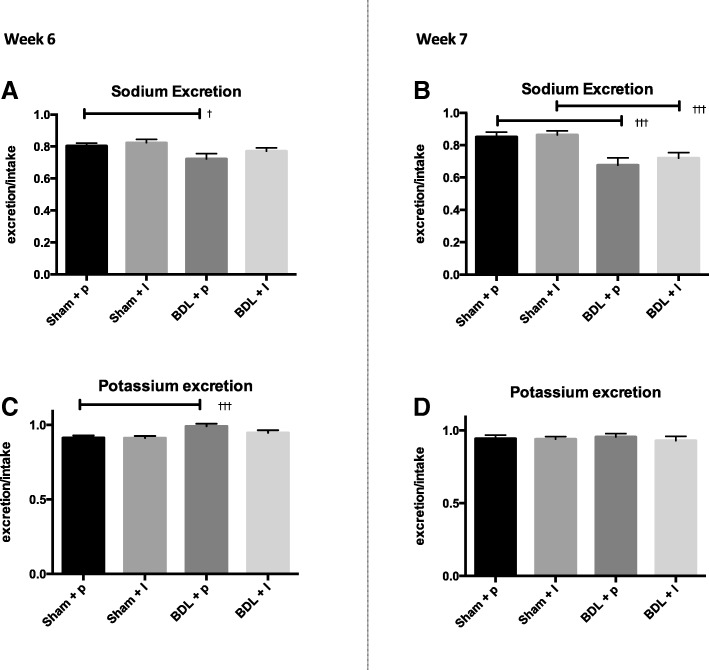
Fig. 2.
Urinary excretion of sodium and potassium for BDL groups and their respective controls after week 6 (left panel) and week 7 (right panel). Sodium and potassium excretion is calculated as excretion/intake. Values are expressed as mean ± SEM, †p < 0.05: Sham vs. BDL, ††p < 0.01 Sham vs. BDL, †††p < 0.001: Sham vs. BDL

