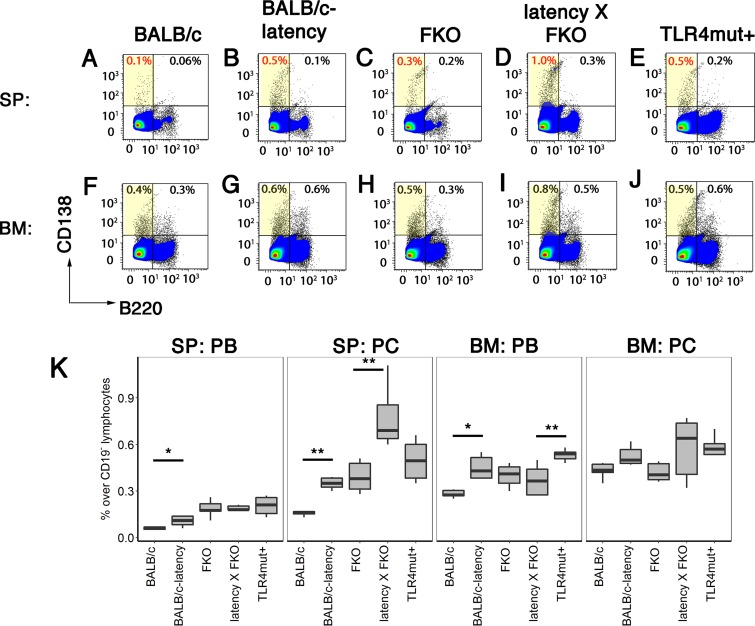
FIG 2.
Increased proliferation of PCs in the BALB/c background. Cells were prepared from spleen or BM of BALB/c, BALB/c latency, FKO, latency × FKO, and latency × FKO × TLR4mt+ mice (all n = 6) and analyzed using three-color flow cytometry. CD19− cells were further gated with CD138 and B220. Representative examples of flow diagrams of of PBs and PCs are shown in panels A to J. (K) Percentages of PBs (CD19− B220+ CD138+) and PCs (CD19− B220− CD138+) are shown on the vertical axis for each of the mouse genotypes indicated on the horizontal axis. Box plots represent the 1st and 3rd quartiles, with the median indicated by the horizontal line. Whiskers are drawn out to 1.5× the interquartile range. Asterisks indicate significance of pairwise comparison using Tukey's post hoc test: *, P ≤ 0.05; **, P ≤ 0.01.

