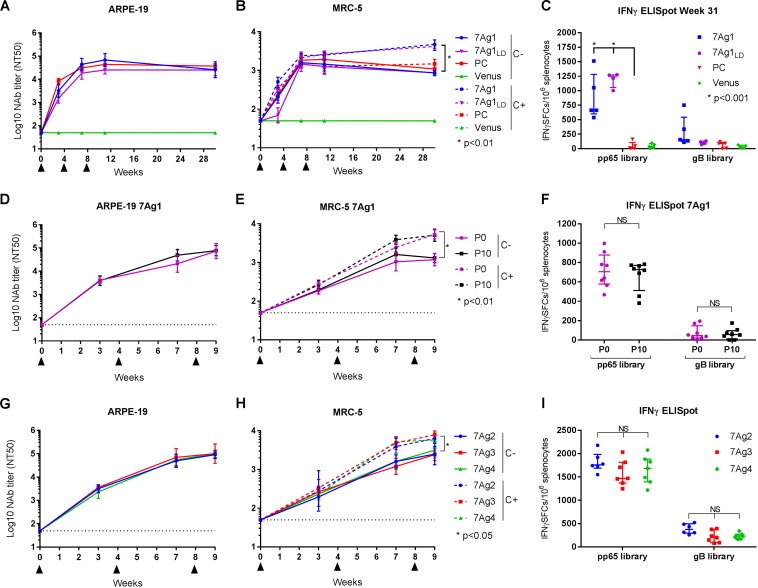
FIG 5.
HCMV immune stimulation by multiantigenic MVA vectors in BALB/c mice. BALB/c mice were immunized three times i.p. in 4-week intervals (triangles) with the multiantigenic MVA vectors, and HCMV NAb and T cell responses were evaluated. HCMV NAb titers were measured at the indicated time points against HCMV TB40/E on ARPE-19 cells in the absence of complement, and on MRC-5 cells in the absence or presence of 5% guinea pig complement. T cell responses were determined ex vivo by IFN-γ ELISpot assay utilizing pp65 and gB peptide libraries. Panels A to C show NAb and T cell responses of BALB/c mice (n = 4 or 5) immunized with MVA-7Ag1 in either standard dose (5 × 10⁷ PFU) or low dose (LD; 1 × 10⁷ PFU) or control vectors MVA-PC and MVA-Venus in standard dose. NAb titers shown in panels A and B were measured over a period of 30 weeks. Ex vivo T cell responses shown in panel C were measured at week 31 after an additional booster immunization at week 30. Panels D to F show NAb and T cell responses of BALB/c mice (n = 8) immunized with MVA-7Ag1 that was derived before (P0) and after (P10) 10 virus passages on CEF. Panels G to I show NAb and T cell responses of BALB/c mice (n = 6 or 7) immunized with MVA-7Ag2, MVA-7Ag3, or MVA-7Ag4. Bars in panels A, B, D, E, G, and H represent geometric means with 95% confidence intervals. Bars in panels C, F, and I represent median values with interquartile ranges. Statistical significance of differences comparing each group in panels A, B, D, E, G, and H was calculated using ANOVA followed by Sidak's multiple-comparison test. Differences between vaccine groups in panels C, F, and I were calculated by multiple t test (NS, P > 0.05).

