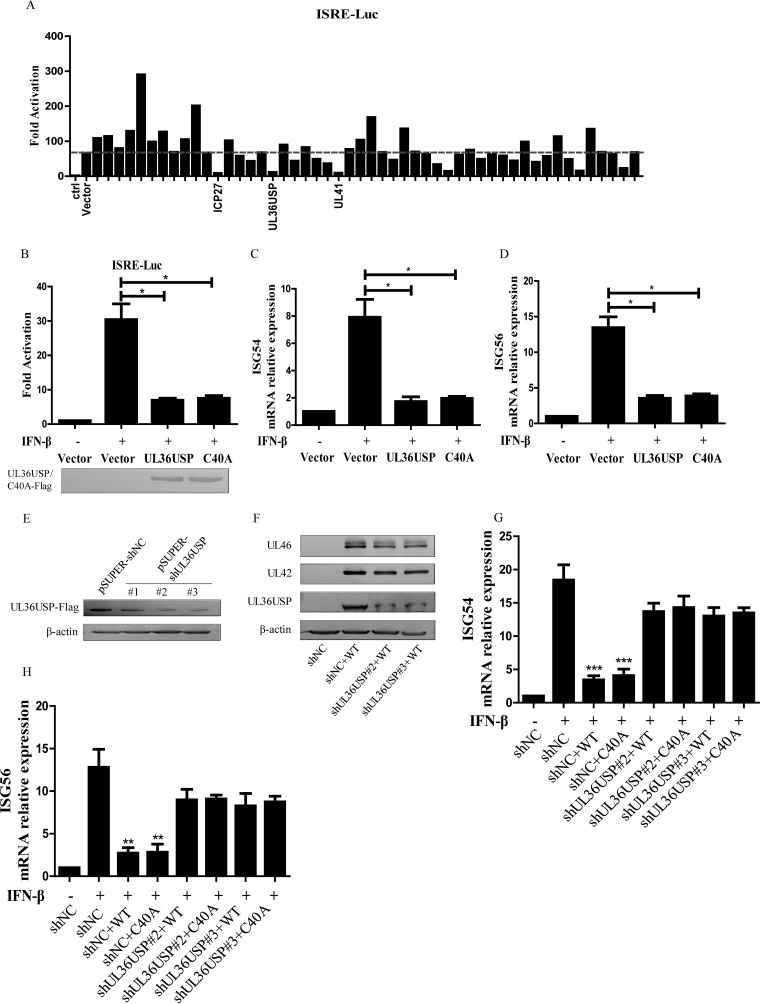
FIG 1.
HSV-1 UL36USP inhibits IFN-β induced activation of ISRE promoter and transcription of ISGs independent of DUB activity. (A) HEK293T cells were cotransfected with ISRE-Luc reporter plasmid, pRL-TK control plasmid, and empty vector or expression plasmids of HSV-1 proteins. At 24 h posttransfection, cells were mock treated or treated with exogenous IFN-β (1,000 U/ml) for 8 h and then subjected to Dual-Luciferase reporter (DLR) assay, and the fold activation was determined compared to that of the empty vector with mock-treated cells. (B) HEK293T cells were cotransfected with ISRE-Luc reporter plasmid, pRL-TK control plasmid, and empty vector, UL36USP-Flag, or C40A-Flag. At 24 h posttransfection, cells were mock treated or treated with exogenous IFN-β (1,000 U/ml) for 8 h and then subjected to DLR assay. The fold activation was determined compared to that of the empty vector with mock-treated cells. (C and D) HEK293T cells were transfected with empty vector, UL36USP-Flag, or C40A-Flag. After 24 h, cells were mock treated or treated with exogenous IFN-β (1,000 U/ml) for 8 h, and qPCR analysis was applied to detect ISG54 (C) or ISG56 (D) mRNA. (E) HEK293T cells were cotransfected with UL36USP-Flag and pSUPER-shNC or the indicated pSUPER-shUL36USP plasmids (#1, #2, and #3), and cells were harvested at 48 h posttransfection and subjected to WB analysis. (F) HEK293T-shNC and HEK293T-shUL36USP (#2 and #3) cells were infected with WT HSV-1 for 20 h at an MOI of 1. Cells were harvested and subjected to WB to analyze the protein levels of UL36USP, UL42, and UL46. (G and H) HEK293T-shNC and HEK293T-shUL36USP (#2 and #3) cells were infected with WT HSV-1 or C40A HSV-1 for 12 h at an MOI of 1, and then IFN-β (1,000 U/ml) was added for another 8 h. Cells were harvested and subjected to qPCR to detect ISG54 (G) or ISG56 (H) mRNA. Asterisks indicates a significant difference from the IFN-β-treated control. Error bars represent standard deviations (SD) from three independent experiments. Statistical analysis was performed using Student's t test (*, 0.01 < P < 0.05; **, 0.001 < P < 0.01; ***, P < 0.0001).

