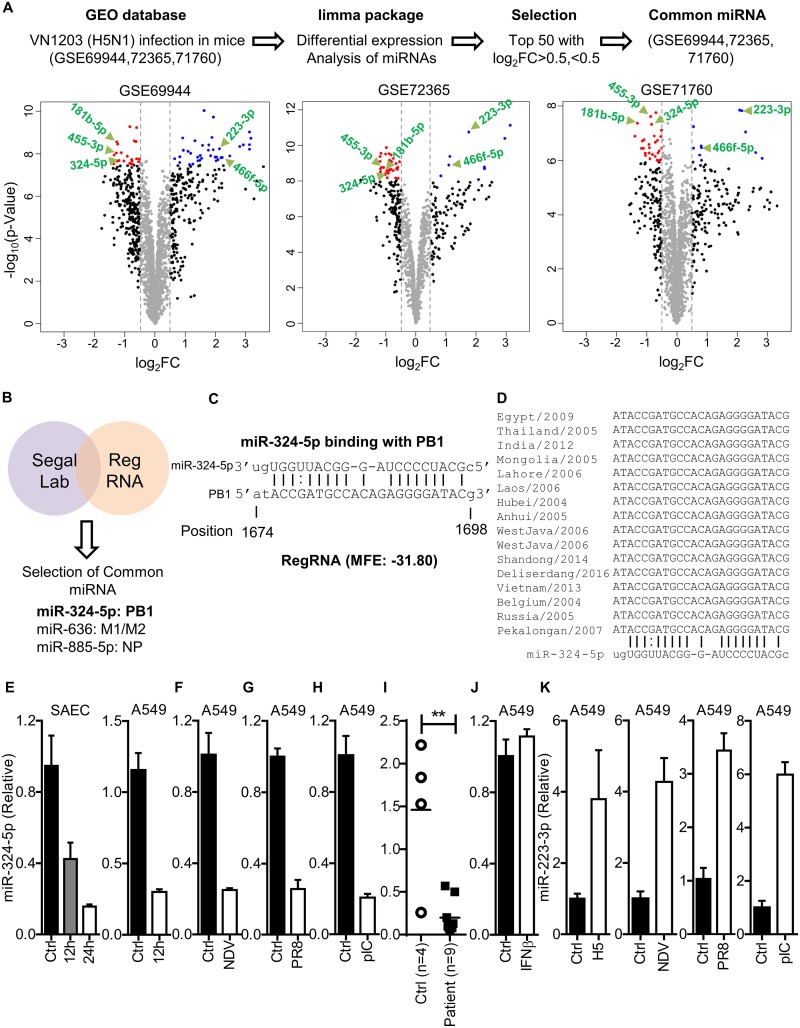
FIG 1.
RNA virus infection downregulates the expression of miR-324-5p. (A) Schematic representation of work flow for data analysis. The volcano plot represents dysregulated miRNAs identified in lung tissue of C57BL/c mice infected with A/Vietnam/1203/2004 (H5N1) (176 PFU/mouse) at day 4 postinfection in three independent microarray data sets using the indicated screening algorithm (upper portion). Common miRNAs that were increased or decreased more than log2 FC (0.5) among the top 50 miRNAs in three independent studies were selected and are shown by the green arrows (lower portion). (B) List of candidate miRNAs targeting the H5N1 genome identified using Segal Lab and RegRNA1.0. The cutoffs used for Segal Lab and RegRNA1.0 were −20 kcal/mol and −25 kcal/mol, respectively. (C) Prediction of the miR-324-5p binding site in the PB1 gene of H5N1 and minimum free energy (MFE) of miRNA-PB1 duplex. The indicated position is relative to the first nucleotide of the PB1 gene. (D) Sequence alignment of the PB1 gene (target sequence) across different clades of H5N1 aligned using ClustalW. (E to H) Quantification of relative expression of hsa-miR-324-5p in SAECs and A549 cells with H5N1 infection (MOI, 1) at the indicated time points (E); A549 cells with NDV infection (MOI, 1) at 24 h (F); A549 cells with A/PR8/H1N1 (PR8) infection (MOI, 1) at 24 h (G); A549 cells with poly(I·C) transfection (1 μg/ml) at 24 h (H). (I) Quantification of relative expression of miR-324-5p in swine flu patients (n = 9) compared to healthy controls (n = 4). (J) Quantification of relative abundance of miR-324-5p in A549 cells in response to stimulation with IFN-β (100 IU/ml) after 12 h. (K) Quantification of relative expression of miR-223-3p in A549 cells infected with H5N1 (MOI, 1), NDV (MOI, 1), and PR8 (MOI, 1) and transfected with poly(I·C) (pIC; 1 μg/ml) at 24 h. Ctrl, control (uninfected); H5, H5N1 virus. Data are means ± SEMs from triplicate samples of a single experiment and are representative of results from three independent experiments (E to K).

