
FIG 1.
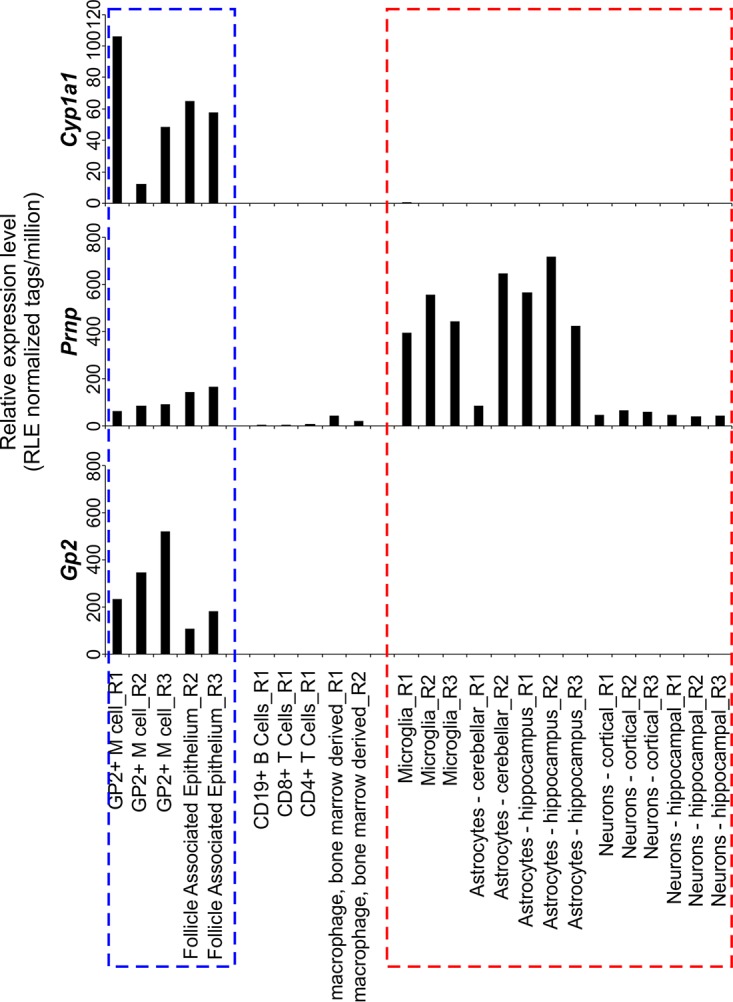
Cyp1a1 is expressed in the follicle-associated epithelium and in M cells in the small intestine. Shown is a comparison of Cyp1a1, Prnp, and Gp2 mRNA expression levels in individual cell populations in deep cap analysis of gene expression (CAGE) sequence data from the FANTOM5 project of the FANTOM consortium (38). Each bar shows the relative expression level of each gene per million reads in each sample [RLE normalized tags/million]. The blue-hatched box highlights the small intestine-derived glycoprotein 2-expressing (GP2+) M cell and the follicle-associated epithelium data sets. The red-hatched box highlights the brain-derived data sets.