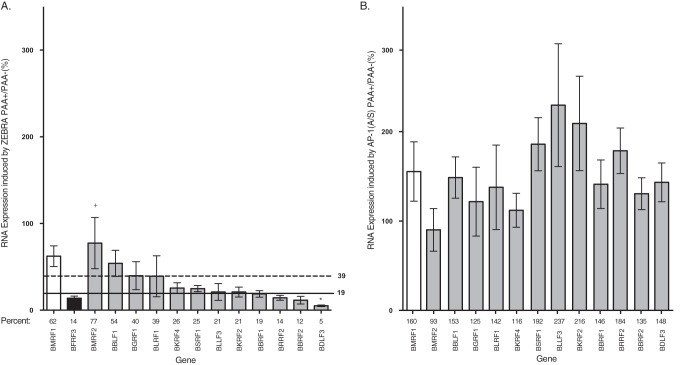
FIG 8.
Expression of a group of late genes when activated by ZEBRA or AP-1(A/S) in response to PAA treatment. Fold change in expression was determined in BZKO cells treated with PAA relative to expression in untreated cells of 12 putative late genes following transfection with ZEBRA (A) or AP-1(A/S) (B). Bar height indicates the mean of three experiments. Error bars show one standard error of the mean. A marker early gene, BMRF1, is shown in white. A marker late gene, BFRF3, is shown in black. The 12 late genes activated by AP-1(A/S) in BZKO cells are shown in gray. In panel A the solid line represents 2 SEM of the expression level of BFRF3 in PAA-treated versus expression in untreated cells. The dashed line represents 2 SEM of expression of BMRF1 in PAA-treated versus expression in untreated cells. Genes with expression values below the solid line are considered late genes, and those with expression values above the dotted line are considered early genes. P values were determined using pairwise Student's t tests with Dunnett's correction for multiple comparisons compared to results with the control early gene BMRF1 or control late gene BFRF3. *, P ≤ 0.0332, compared to results with the BMRF1 control; +, P ≤ 0.0332 compared to results with the BFRF3 control. In panel B, BRFR3 was not shown because it was expressed at very low levels (<5% of the level expressed in cells transfected with ZEBRA).

