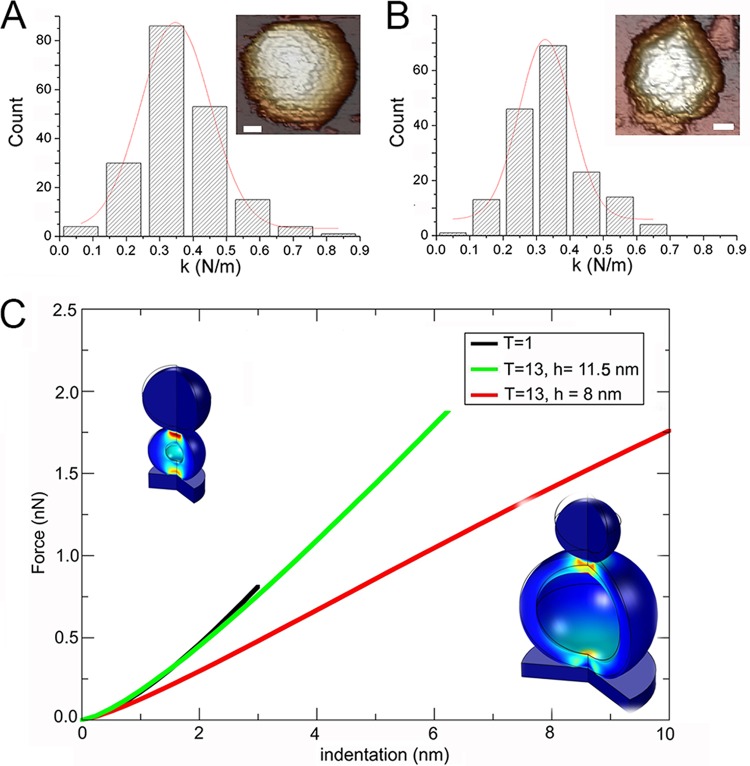
FIG 6.
Mechanical rigidity of E1 T=13 and T=1 capsids and finite element simulations that mimic AFM indentations. (A, B) Histograms of slopes of the indentation curves for E1 T=13 (A) and T=1 capsids (B), showing rigidity values (spring constant, k) for individual particles after nanoindentation. The k value for each population was calculated by Gaussian fits, with kE1-T=13 being equal to 0.347 ± 0.104 N/m (A) and kT=1 being equal to 0.327 ± 0.085 N/m (B). For E1 T=1 capsids, kE1-T=1 was equal to 0.309 ± 0.127 N/m. (Insets, top right) AFM images of individual T=13 (bar, 200 Å) and T=1 (bar, 100 Å) particles are shown. (C) Force-indentation curves obtained by FE simulation to mimic AFM experiments for IBDV T=13 and T=1 capsids. Values are shown for the T=1 capsid (black), the T=13 capsid using r equal to 35 nm and an 8-nm-thick layer (red), and the T=13 capsid with the thickness increased to 11.5 nm (green) to match the spring constant measured in the experiments.

