FIG 3.
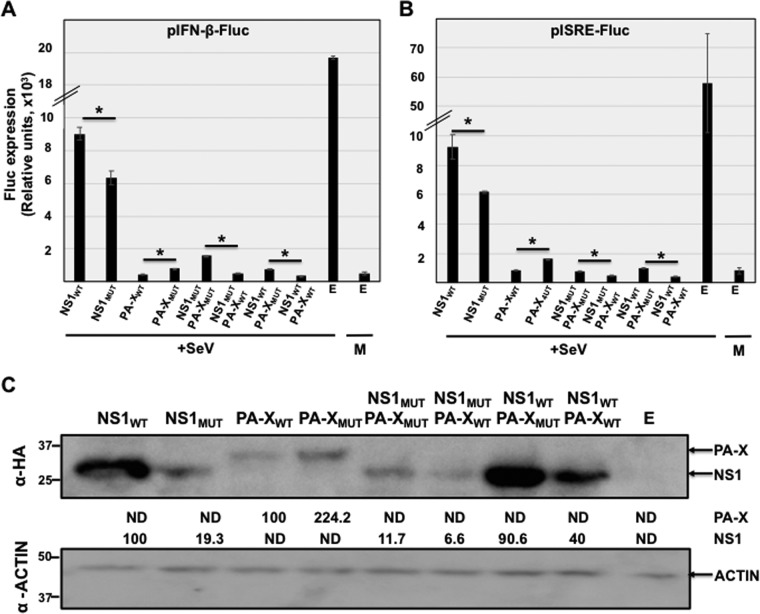
Effect of pH1N1 NS1 and PA-X amino acid changes on IFN responses induced by SeV infection. (A and B) HEK293T cells were transiently cotransfected, using calcium phosphate, with the indicated HA-tagged NS1- and PA-X-expressing pCAGGS plasmids, together with plasmids expressing Fluc under the control of an IFN-β (A) or an ISRE (B) promoter. NS1MUT encodes the amino acid changes E55K, L90I, I123V, E125D, K131E, and N205S. PA-XMUT encodes the amino acid changes V100I, N204S, R221Q, and L229S. An empty (E) pCAGGS plasmid was included as an internal control. At 24 hpt, cells were mock infected (M) or infected (MOI of 3) with the SeV Cantell strain (+SeV) to induce the activation of the IFN-β (A) or the ISRE (B) promoters. At 16 hpi, cell lysates were prepared for reporter gene expression. Fluc expression was measured by luminescence. Data show the means and standard deviations of the results determined for triplicate wells. Experiments were repeated 3 times in triplicate, with similar results. *, P < 0.05 (NS1WT versus NS1MUT, PA-XWT versus PA-XMUT, NS1MUT/PA-XMUT versus NS1MUT/PA-XWT, and NS1WT/PA-XMUT versus NS1WT/PA-XWT) using Student's t test (n = 3 per time point). (C) pH1N1 PA-X and NS1 and cellular actin protein expression levels were analyzed by Western blotting using cell extracts and antibodies specific to the HA tag (to detect PA-X and NS1 proteins [top and bottom bands in the top blot, respectively]) and actin (loading control) (bottom blot). Western blots were quantified by densitometry using ImageJ software (v1.46), and the amounts of PA-X and NS1 proteins were normalized to the amounts of actin (top and bottom numbers, respectively, between the two blots). Protein expression in cells transfected with the pCAGGS plasmid expressing NS1WT and PA-XWT was considered 100%. ND, not detected. Molecular mass markers (in kilodaltons) are indicated on the left. The experiments were repeated 3 times, with similar results.

