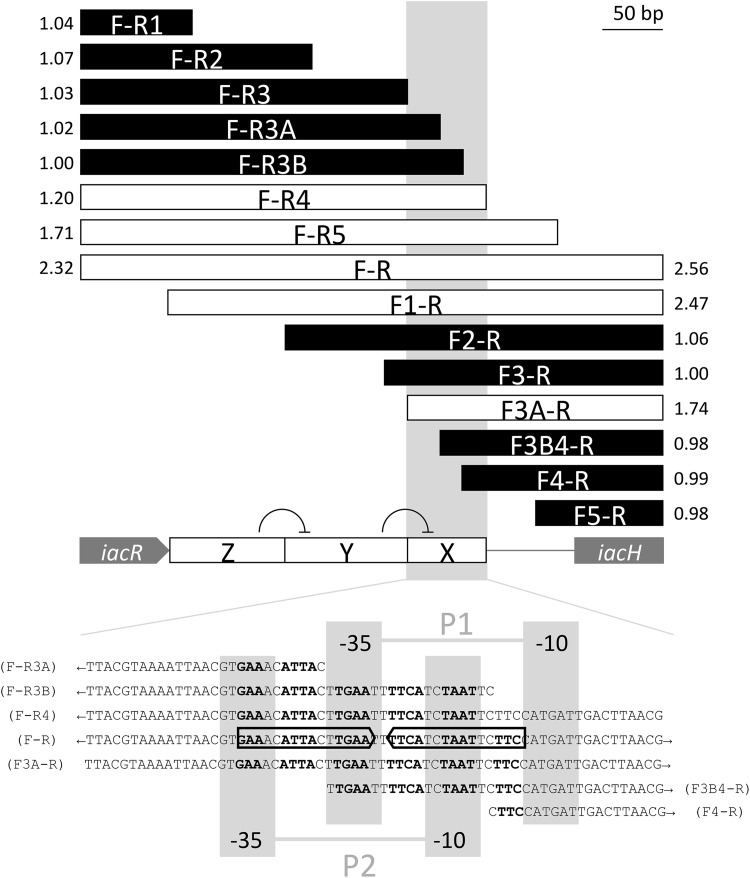
FIG 9.
Deletion analysis of the iacR-iacH intergenic region to locate putative iacH promoters and IacR operator sites. The F-R bar represents the full 480-bp DNA fragment that was amplified from E. soli LF7 using primer pair F and R (Table 3) and fused to a promoterless gfp gene in pPROBE′-gfp[AAV] to test responsiveness to 200 μM IAA in a LF7 wild-type background. All other bars represent subfragments of F-R, using either F or R in combination with another forward or reverse primer (e.g., F-R5 represents an amplicon obtained with primers LF7iacHProm1F and LF7HpromFNDRREV5SalIR, see Table 3). White bars represent fragments that showed IAA inducibility, while black bars represent fragments that did not respond to IAA. The number next to each bar is a measure for inducibility, expressed as the ratio of mean FCR of IAA-exposed cells to the mean FCR of unexposed cells, measured 1 h after IAA exposure. The boxed gray area (also marked as region X on the iacR-iacH intergenic region) represents a sequence within F-R that is minimally required for transcriptional response to IAA. Within this sequence (shown at the bottom of the figure), we identified two possible −35/−10 promoters (P1, TTGAAT/CATGAT; and P2, GTGAAA/TCTAAT) as well as an imperfect 16-bp inverted repeat (5′-GAAnnATTAnnTGAAnnTTCAnnTAATnnTTC-3′) overlapping both promoters and possibly representing an IacR operator site. The results of the deletion analysis are consistent with a model where the presence of sequence Z on the iacR-iacH intergenic region is required to reverse the negative effect of sequence Y on the IacR-regulated expression of iacH from sequence X (see the text for more details on this proposed model).

