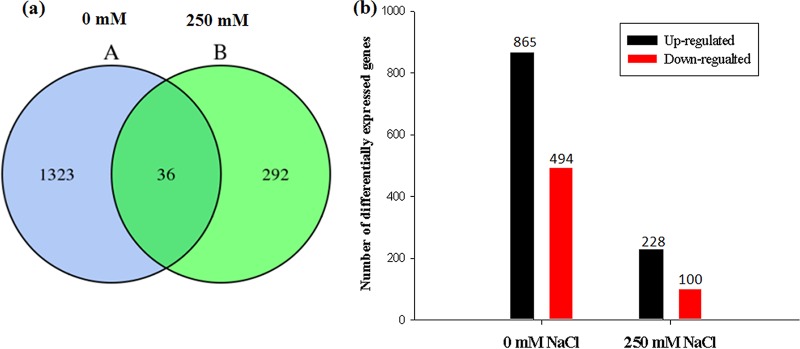
FIG 6.
Differentially expressed genes (DEGs) in KLBMP 5180-inoculated and noninoculated plants treated with 0 and 250 mM NaCl. (a) Venn diagram indicating unique and shared DEGs (A, 0 mM NaCl; B, 250 mM NaCl). (b) DEGs up- and downregulated in inoculated plants treated with 0 and 250 mM NaCl compared to that of noninoculated plants.

