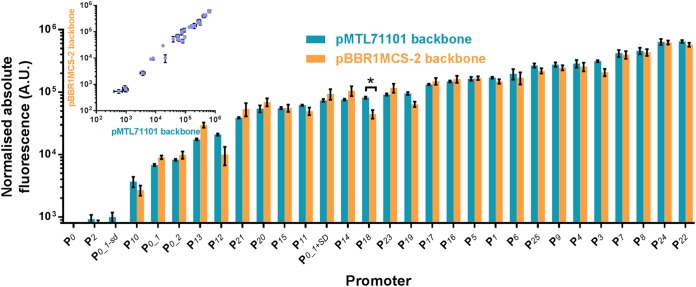
FIG 2.
Quantitative evaluation of constitutive promoter strengths. The strengths of different promoters were determined by their abilities to drive expression of the fluorescence reporter. C. necator H16 cells harboring the variants of promoter-reporter constructs in either the pBBR1MCS-2 or pMTL71101 backbone were grown in MM as described in Materials and Methods. To determine normalized absolute fluorescence, the optical density at 600 nm and EYFP fluorescence were measured. Error bars represent standard deviations from three biological replicates. The asterisk indicates statistically significant difference between promoter strengths in different vector backbones (P < 0.05, unpaired t test). Correlation between strengths of respective promoters placed in two different plasmid backbones, pBBR1MCS-2 and pMTL71101, is shown in the inset.

