Figure 2.

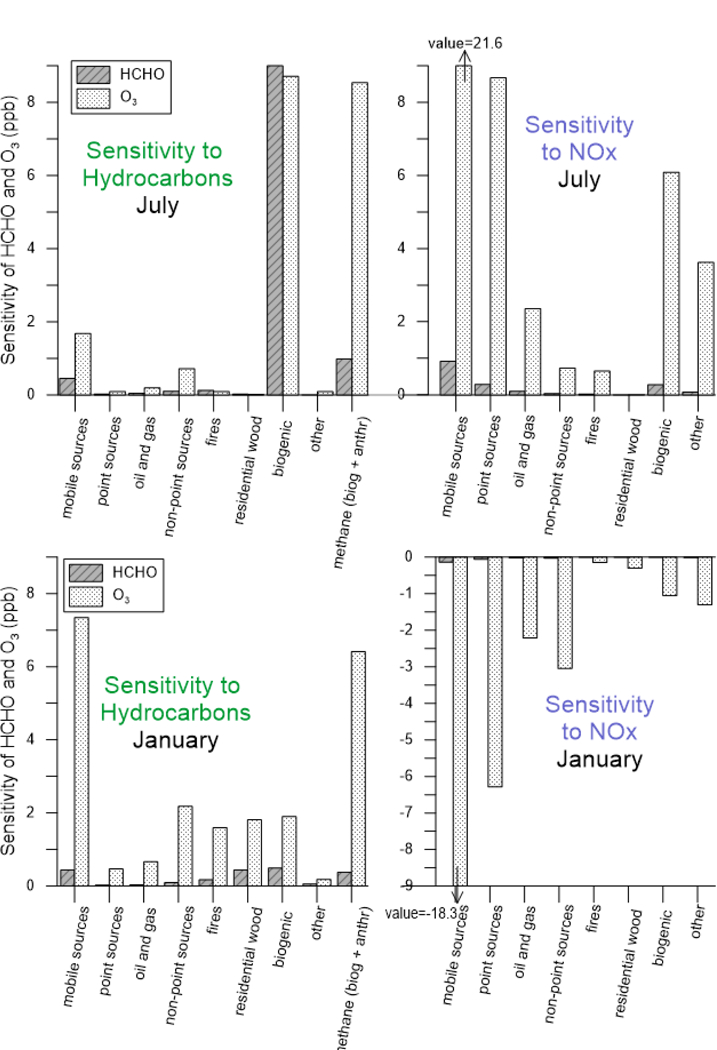
Sensitivity of HCHO and O3 to source types, separated by hydrocarbons and NOx emissions for the months of July (top) and January (bottom). Sensitivities are calculated on a national basis.

Sensitivity of HCHO and O3 to source types, separated by hydrocarbons and NOx emissions for the months of July (top) and January (bottom). Sensitivities are calculated on a national basis.