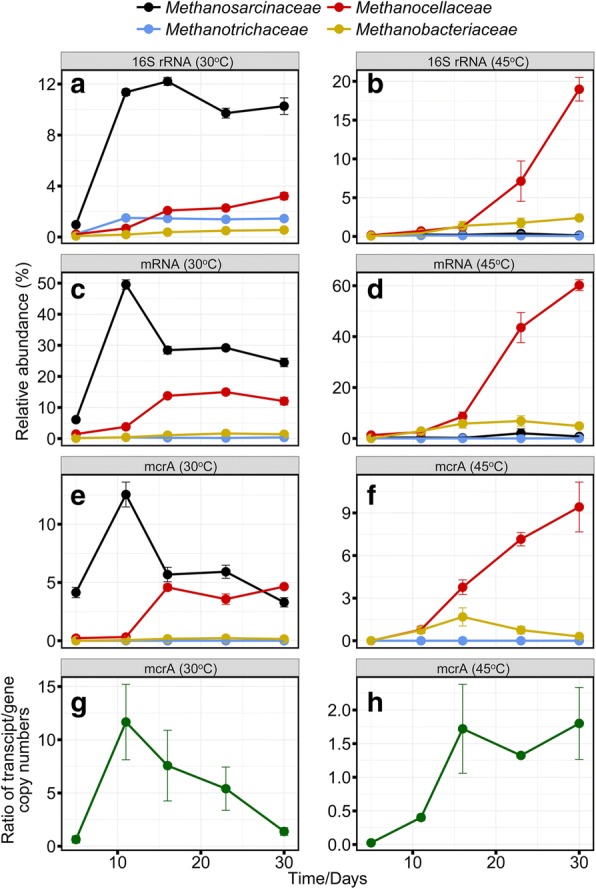
Fig. 6.

Family-level dynamics of archaeal 16S rRNA (a, b), methanogenic mRNA (c, d) and mcrA transcripts (e, f) in metatranscriptomic analysis (means ± SE, n = 3) and the temporal dynamics of the mcrA transcript/gene ratio (g, h) as determined by qPCR (gene) and RT-qPCR (transcripts) (means ± SE, n = 3). Results are shown for 30 °C and 45 °C
