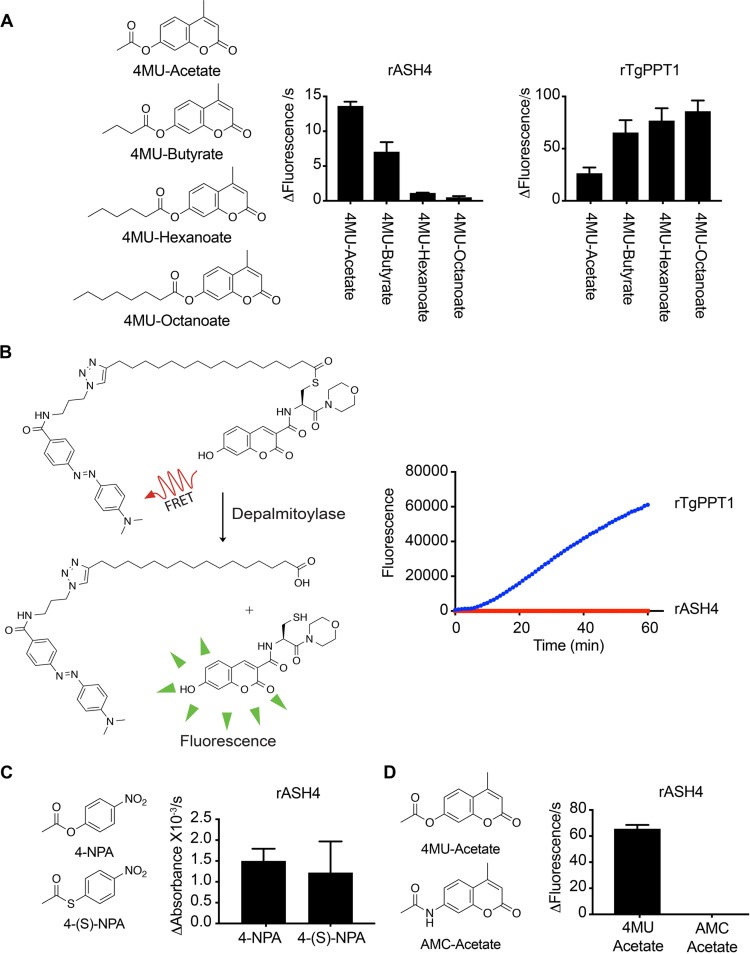
FIG 1.
ASH4 is an acetyl esterase. (A) Structures of the 4-methyllumbelliferone ester substrates and their rates of processing by rASH4 and rTgPPT1. Graphs show the rate of fluorescence change per second, and data are plotted as averages of results from three independent experiments repeated in technical triplicate. (B) Structure of the quenched fluorogenic substrate, QStE, for depalmitoylase activity. The graph at the right depicts a representative progress curve for processing of the QStE substrate by rTgPPT1 and rASH4. Data represent averages of results from 3 technical replicates. Error bars show the standard deviations. (C) Structures of 4-nitrophenyl acetate (4-NPA; ester substrate) and 4-nitrothiolphenyl acetate (4-S-NPA; thioester substrate) substrates. The graph at right shows the average rate at which rASH4 cleaves each substrate. The graph depicts averages of results from three independent experiments repeated in technical triplicate. Error bars indicate standard errors of the means. (D) Structures of 4-methyl-2-oxo-2H-chromen-7-yl acetate (4MU-acetate; ester substrate) and N-(4-methyl-2-oxo-2H-chromen-7-yl) acetamide (AMC-acetate; amide substrate). The graph at right shows the average rate of hydrolysis of each substrate by rASH4. The graph represents results from three independent experiments repeated in technical triplicate. Error bars indicate standard errors of the means.

