FIG 2.
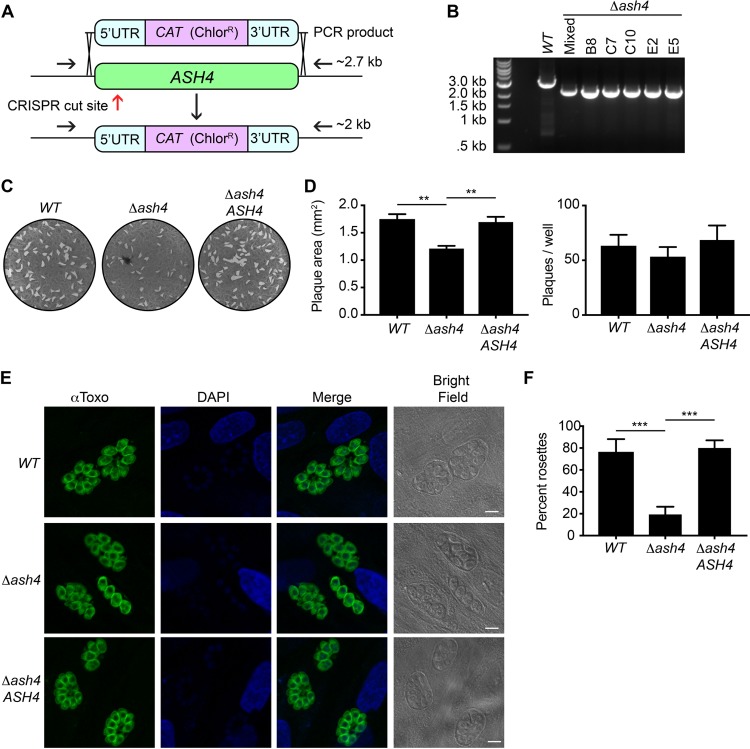
Loss of ASH4 results in disordered vacuoles and reduced area of infection in vitro. (A) Diagram of the ASH4 knockout strategy. The red arrow indicates the approximate location of the CRISPR/Cas9 cut site. Black arrows indicate primers used to confirm ash4 deletion. The intact ASH4 locus produces a band of ∼2.7 kb, while the ash4 deletion results in a 2-kb band upon PCR amplification using the shown primer locations. (B) PCR results from the wild type (WT), a chloramphenicol-resistant population (Mixed), and five Δash4 clones. Clone E2 was used in subsequent experiments. (C) Representative images of plaque assays from wild-type (WT), Δash4, and ASH4 rescue (Δash4 ASH4) parasites. (D) Quantification of average plaque size in square millimeters (left) and total plaque numbers (right). Data plotted are from 5 independent experiments performed in technical duplicate. Error bars indicate standard errors of the means. One-way analysis of variance (ANOVA) was performed with a subsequent Tukey’s multiple-comparison test to determine significance. **, P < 0.01. (E) Indirect immunofluorescence images of wild-type (WT), Δash4, and ASH4 rescue (Δash4 ASH4) parasites stained with anti-Toxo (α-Toxo) antibody and DAPI. Bright-field images are shown to highlight vacuoles. Scale bars are 5 μm. (F) Quantification of percentages of parasites in ordered rosettes for wild-type (WT), Δash4, and ASH4 rescue (Δash4 ASH4) parasites. The graph presents averages of results from three independent experiments in which at least 50 vacuoles were counted per strain. Error bars indicate the standard deviations. One-way ANOVA was performed with Tukey’s multiple-comparison test to determine significance, with all statistically significant comparisons indicated. ***, P < 0.001.

