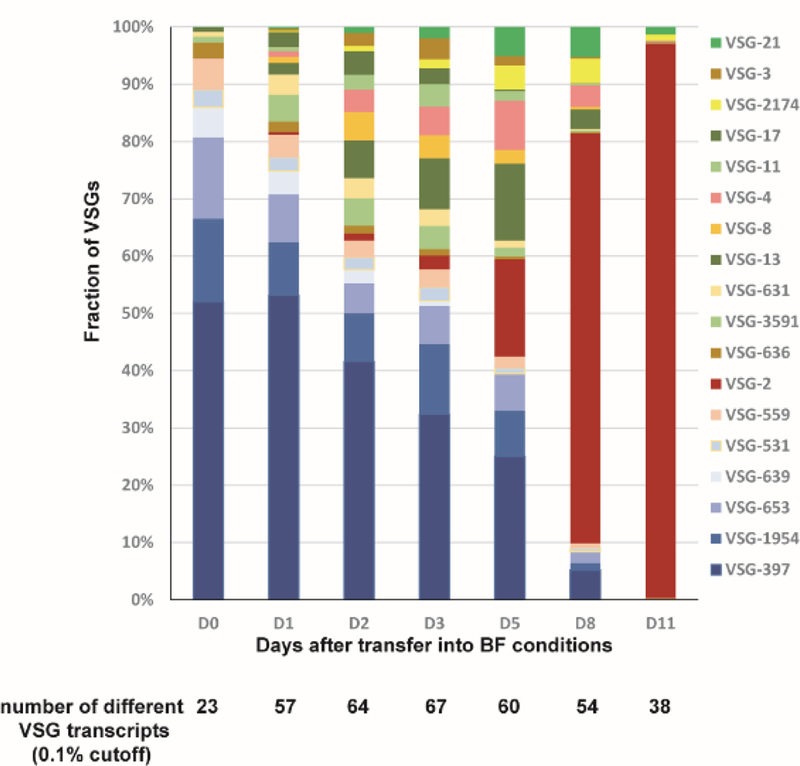
Fig. 6. Dynamics of VSG expression during transformation from metacyclics (D0) to bloodstream forms (D11).

Each colored box represents an individual VSG’s presence in the population. Only variants present at greater than 0.1% of the population at each time point are shown. Metacyclic VSGs are shown in shades of blue.
