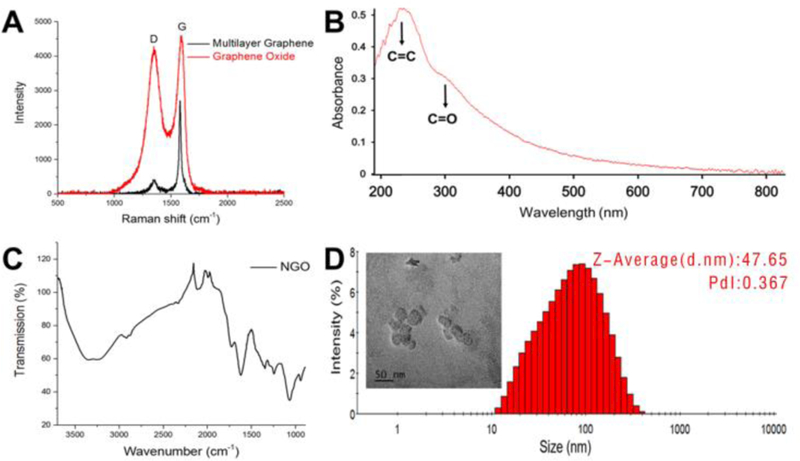
Fig. 2.

Characterizations of NGO. A) Raman spectra of NGO. The G peak of the graphene oxide becomes wider and shifted to 1585cm−1, and the D peak at 1345cm−1 becomes stronger after oxidation. B) UV-vis spectra of NGO. The characteristic absorption peaks of C=O and C=C at 230 nm and 300 nm appeared. C) FT-IR spectra of NGO, which proved the presence of C=O at the edge of NGO at 1730 cm−1. D) Hydrodynamic size distribution and TEM image (inset) of NGO. Scale bar is 100 nm.
