
Figure 1.
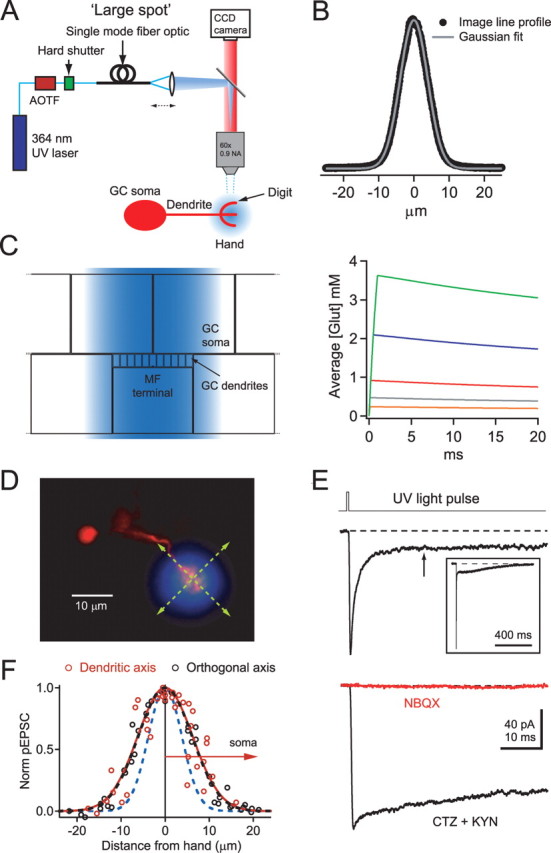
Glutamate uncaging with a large UV illumination spot produces step-like glutamate concentration changes. A, Simplified optical configurations for the large UV illumination spot with a diagram of a GC soma, dendrite, “hand,” and “digit.” A large collimated illumination spot was generated by coupling a UV laser beam into a single-mode fiber optic whose output was focused at the back aperture of the objective. B, Intensity profile for the large UV spot measured from a CCD image of fluorescence produced by illuminating a monolayer of beads. The gray trace shows a fit to a Gaussian function. C, Schematic diagram showing an x–z cross section through part of the extended diffusional space and large-spot illumination profile (blue) used for large-spot uncaging simulations. Right is simulated [Glut]cleft transients produced by large-spot illumination for various uncaging durations and intensities (0.1 ms for an uncaging rate k = 0.37 ms−1, and 0.1–1 ms for k = 0.73 ms−1). Traces represent spatial averages over the glomerulus calculated from five PSD measurements at equal distances from the center to the edge and their corresponding radial areas (200-nm-wide rings). D, Fluorescence image of the soma and dendrite of a GC with a semitransparent image of the large UV spot superimposed. Green lines illustrate scan directions in F. E, pEPSC evoked using the large UV spot and 0.5 ms pulse duration. Inset shows full pEPSC from a different cell on a longer timescale. Arrow indicates the 18 ms point. The bottom traces are current responses in the presence of 100 μm CTZ and 2 mm KYN (black), followed by the addition of 100 μm NBQX (red). F, Normalized current amplitudes evoked with the large UV spot at different locations along dendritic axis (red symbols, arrow indicates direction toward soma) or orthogonal to dendritic axis (black symbols). Gaussian fits gave FWHMs of 14.7 and 14.4 μm for the dendritic and orthogonal axis, respectively. Blue dashed line shows a Gaussian fit to large UV spot illumination profile (B).