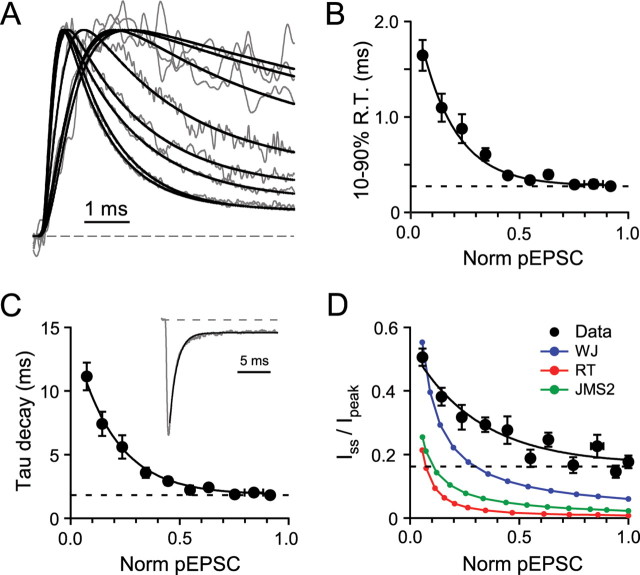
Figure 3.
Kinetic properties of synaptic AMPARs at various receptor occupancies. A, Normalized traces from Figure 2A and their fit to an empirical rising and decaying function (Eq. 1). B, Relationship between 10–90% rise time (R.T.) of the pEPSCs and fraction of saturated current for each cell (Norm pEPSC; n = 20). Only pEPSCs activated with brief illumination durations were used (≤200 μs; x and y error bars indicate SEM). The solid line is an exponential fit using a floating offset. Dashed line indicates the limiting value (i.e., the last value corresponding to the last data point). C, Relationship between the decay time constant of pEPSC and normalized pEPSC activated with brief illumination pulses (≤200 μs; n = 20). Solid line is a single-exponential fit to the data points, and the dashed line shows the limiting decay time constant. Inset shows an example of a single-exponential fit (black) to the decay of a large-spot pEPSC. D, Relationship between the fractional steady-state current (Iss/Ipeak) at 18 ms after the light pulse (filled circles) and the peak amplitude of the normalized pEPSCs (n = 16). The solid line is an exponential fit to the data. The long dashed line shows the limiting value of Iss/Ipeak calculated from the last two 18 ms points. Color symbols represent the Iss/Ipeak measured at 10 times decay time constant for the three native AMPAR model simulations in response to step changes in [Glut]. WJ is Wadiche and Jahr (Wadiche and Jahr, 2001), RT is Raman and Trussel (Raman and Trussell, 1995), and JMS2 is Jonas, Major, and Sakmann scheme 2 (Jonas et al., 1993). For these simulations [Glut] values were adjusted to reproduce the range of fractional activation of the GC experimental data.

