
Figure 7.
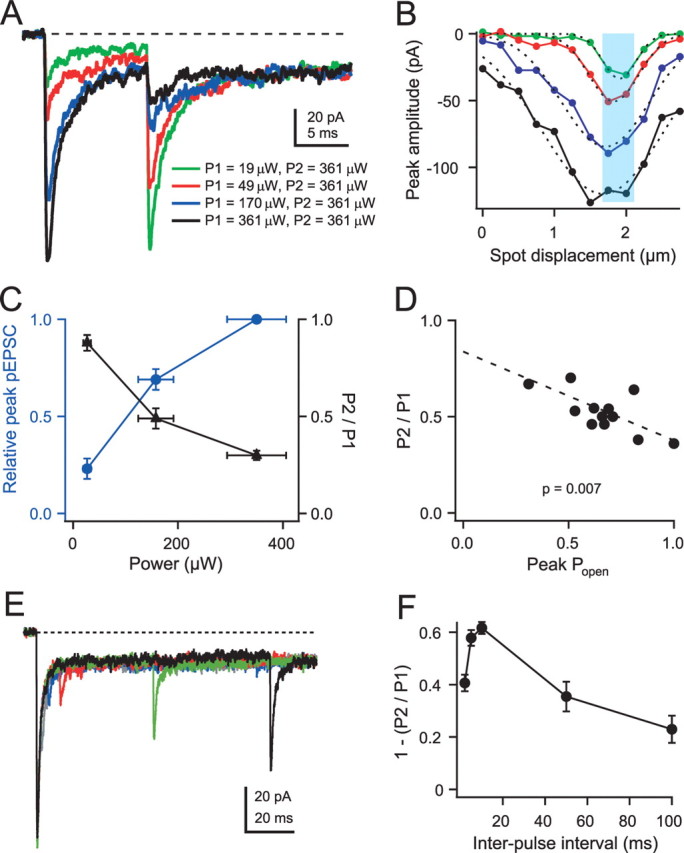
Desensitization properties after transient AMPAR activation using paired-pulse small-spot UV photolysis. A, pEPSCs in response to pairs of 20 μs small-spot illumination pulses using a 10 ms interval. Light intensity of the first pulse (P1) was varied, whereas the intensity of the second pulse (P2) was maintained at the highest (saturating) intensity of the first pulse. B, Amplitudes of small-spot pEPSC responses at different distances for P1 across a dendritic digit in same region as A. Color coding indicates different light intensities as for P1 in A. Dotted lines show Gaussian fits with FWHMs of 0.55, 0.82, 1.44, and 2.00 μm (for green to black P1 intensity). Cyan region shows region over which traces in A were collected and averaged. C, Relationships between fractional activation of the first pulse (blue circles) or P2/P1 pEPSC amplitude ratio (black triangles) and light intensity. Mean P2/P1 amplitude ratios were 0.88 ± 0.04 (n = 6), 0.49 ± 0.05 (n = 6), and 0.30 ± 0.02 (n = 7) for low, medium, high light levels, respectively. D, Relationship between P2/P1 pEPSC amplitude ratio and channel open probability (Popen) for 13 cells. Dashed line shows linear regression fit with right-hand intercept of 0.38 for a Popen = 1. E, High-intensity paired-pulse pEPSC responses for various interpulse intervals (2 ms, gray; 5 ms, blue; 10 ms, red; 50 ms, green; 100 ms, black). F, Relationship between 1 − (P2/P1), which indicates the fraction of desensitization, and interpulse interval for 10 cells.