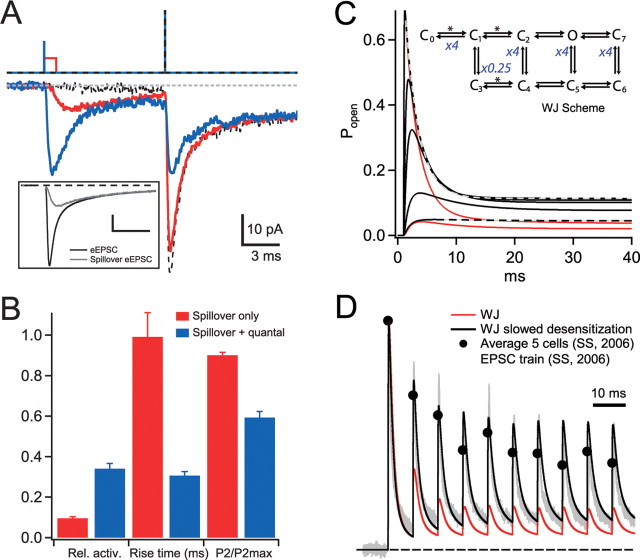
Figure 8.
Weak desensitization of pEPSCs at low receptor occupancies. A, pEPSCs in response to a 10 ms paired-pulse protocol (top traces), in which P1 intensity was set to a low and long duration to mimic activation by glutamate spillover alone (<1 μW, 1 ms; red traces) or a brief intermediate intensity to mimic the quantal and spillover current components together (20 μs, 15–30 μW; blue traces). P2 was set to a brief high intensity. A maximal pEPSC response to P2 was obtained when P1 was omitted (dashed line). For comparison, the inset shows the overall mean AMPAR-mediated synaptic eEPSC and the spillover-mediated eEPSC taken from DiGregorio et al. (2002). Calibration: 10 pA, 3 ms. B, Summary plot for five cells, showing fractional pEPSC activation (Rel. active.), 10–90% rise time, and fractional activation of P2 (P2/P2max) for quantal-plus-spillover and spillover-only pEPSC responses. In these experiments, when P1 and P2 were both maximal, P2/P1 was 0.31 ± 0.02, indicating a near saturated response, similar to that obtained for the dataset in Figure 7. C, Simulated AMPAR responses of the kinetic scheme (Wadiche and Jahr, 2001) with modified rate constants indicated in blue (inset): rate constants between C1–C3 was decreased by fourfold, whereas C1–C0, C4–C2, C5–O, and C6–C7 were all increased fourfold. The desensitization states are C3–C7, and the asterisks denote [Glut]-dependent transitions. The [Glut] was stepped from 0 to 0.1, 0.2, 0.5, 1, and 10 mm for 100 ms. Gray dashed lines are single-exponential fits. Red lines are the step responses of the WJ model for 0.06 and 10 mm. D, Response of modified AMPAR model (black; from C) to a simulated [Glut]cleft waveform train (data not shown). Mean EPSC trains were constructed for each kinetic scheme by feeding 500 stochastic [Glut]cleft trains through the model and averaging the currents. The peak [Glut]cleft of the quantal component was ∼8 mm, and the steady-state level was 0.06 mm at the end of 10 stimuli. All traces are normalized to their first peak amplitude. The gray trace is a recorded EPSC train from the MF–GC synapse, and the filled circles are mean values averaged across five cells (both taken from Saviane and Silver, 2006). The simulated EPSC trains with the modified kinetic scheme produce much less depression than the original WJ model (red) and are comparable with the experimental data (SS) (Saviane and Silver, 2006). The peak open probabilities were 0.22 and 0.27 for the modified AMPAR model and the WJ model, respectively.

