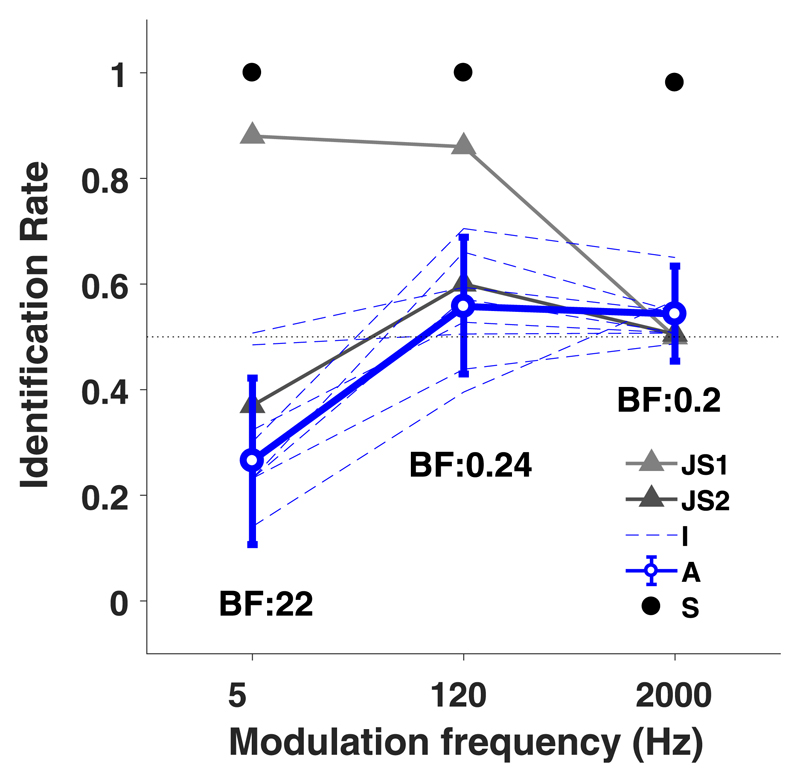
Fig. 5.
(Color online) Results of discrimination experiment, pooled for all subjects. AM identification rate (θ) is shown for three modulation frequencies. Thick blue line (“A”) shows group level identification rates from the current experiments. Individual subject data are shown in dotted blue (“I”). Group level single-target identification rates are shown as black dots (“S”). Error bars indicate 95% HDIs. Numbers below data points indicate Bayes factors per modulation frequency. The 5 Hz modulation frequency data show that, despite task instructions, participants indicate GWN sound location as the AM sound location. Data “JS1” and “JS2” (gray) are identification results for the two distinct responder groups in Johnson et al. (2015). Note that these results are not provided as identification rates θ, but by the relative identification score, K/N and that error bars are therefore missing.

