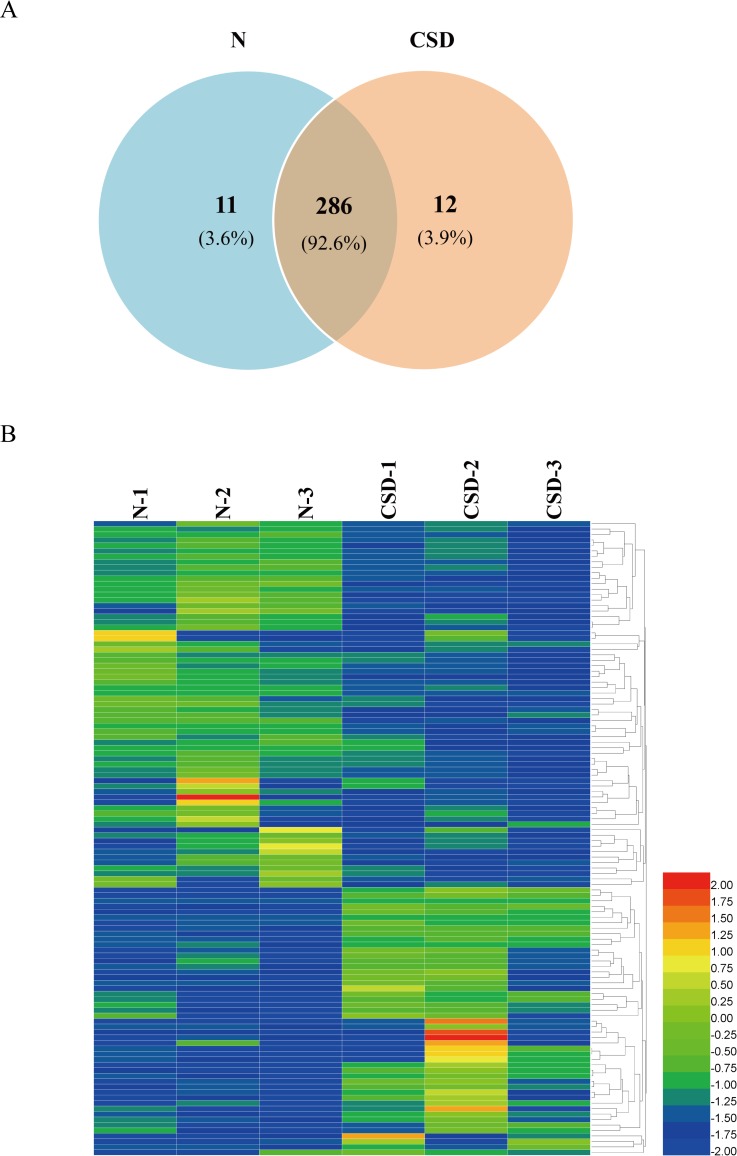
Fig 2. Overview of the DAPs between N- and CSD-groups.
(A) Area-proportional Venn diagram depicts the overlap of the identified serum proteins between N- and CSD-group rats from mass spectrometry measurements. A total of 309 non-redundant proteins with 297 and 298 proteins were identified in N- and CSD-groups, respectively. 286 proteins were found in both groups. (B) A heat map analysis of the DAPs between N- and CSD-group. 117 proteins displayed more than 1.8-fold quantitative alteration, of which 49 proteins were upregulated and 68 were downregulated in the CSD-group compared to that of the N-group. Color depth from blue to red indicates the intensity detected by LC-MS analysis from low to high.

