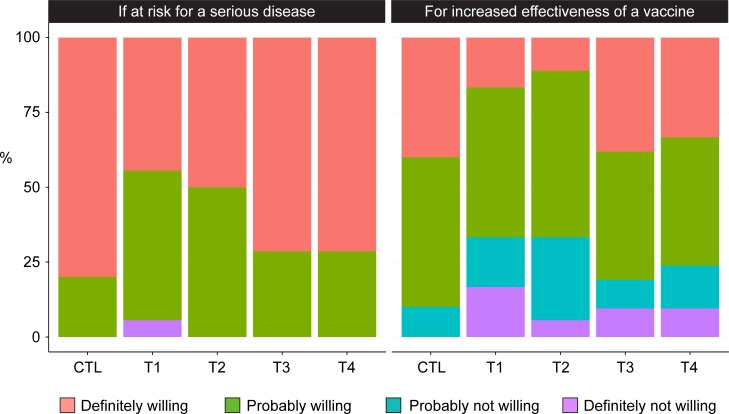
Fig 7. Willingness to undergo electroporation, by treatment group.
Bar graphs show the percentage of participants in each treatment group reporting willingness to undergo EP, in response to these questions, as assessed 2 weeks after the last injection with EP: Left panel: How willing would you be to undergo electroporation if it were required for a new vaccine against a serious disease if you were at risk for that disease? Right panel: How willing would you be to undergo electroporation if it increased the effectiveness of a vaccine we already have, such as the influenza vaccine?

