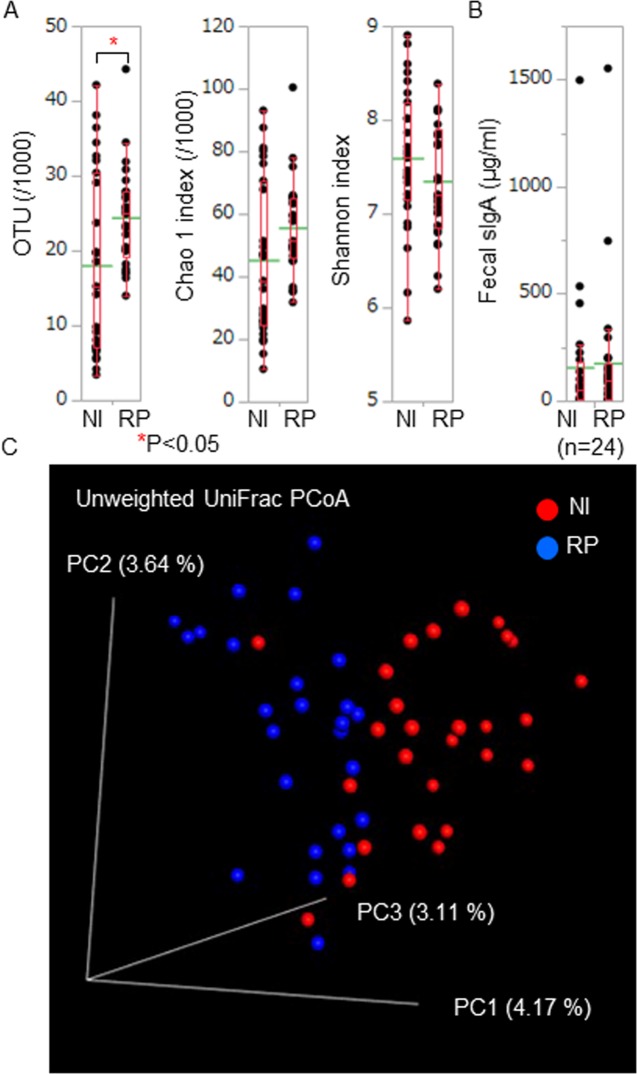
Fig 1. Bacterial numbers and diversity of RP gut microbiota.
(A) We estimated OTU numbers (annotated species numbers) and α diversity scores (Chao 1 and Shannon indexes) of each sample. OTU numbers of RP patients (RP) were significantly higher than those of normal individuals (NI). Chao 1 and Shannon index scores were comparable between RP patients and normal individuals. (B) We measured fecal sIgA concentrations and compared the data between RP patients and normal individuals. Fecal sIgA concentrations were comparable between RP patients and normal individuals. These biological parameters of RP patients and normal individuals were displayed with dot plots. A box-plot and a mean level (green line) of each group of RP patients and normal individuals were indicated. (C) We estimated β diversity between RP patients and normal individuals. We showed the PCoA plots in a three dimensional structure where three axes and each contribution ratio were depicted. We exploratory evaluated the distance between the distribution of RP patients and that of normal individuals using two-sided Student's two-sample t-test and Monte Carlo permutations. We obtained a significant P value of the β diversity between RP patients and normal individuals in unweighted UniFrac PCoA (P = 0.01).

