
Fig 4. Foxp3 gene expressions in PBMC of RP patients.
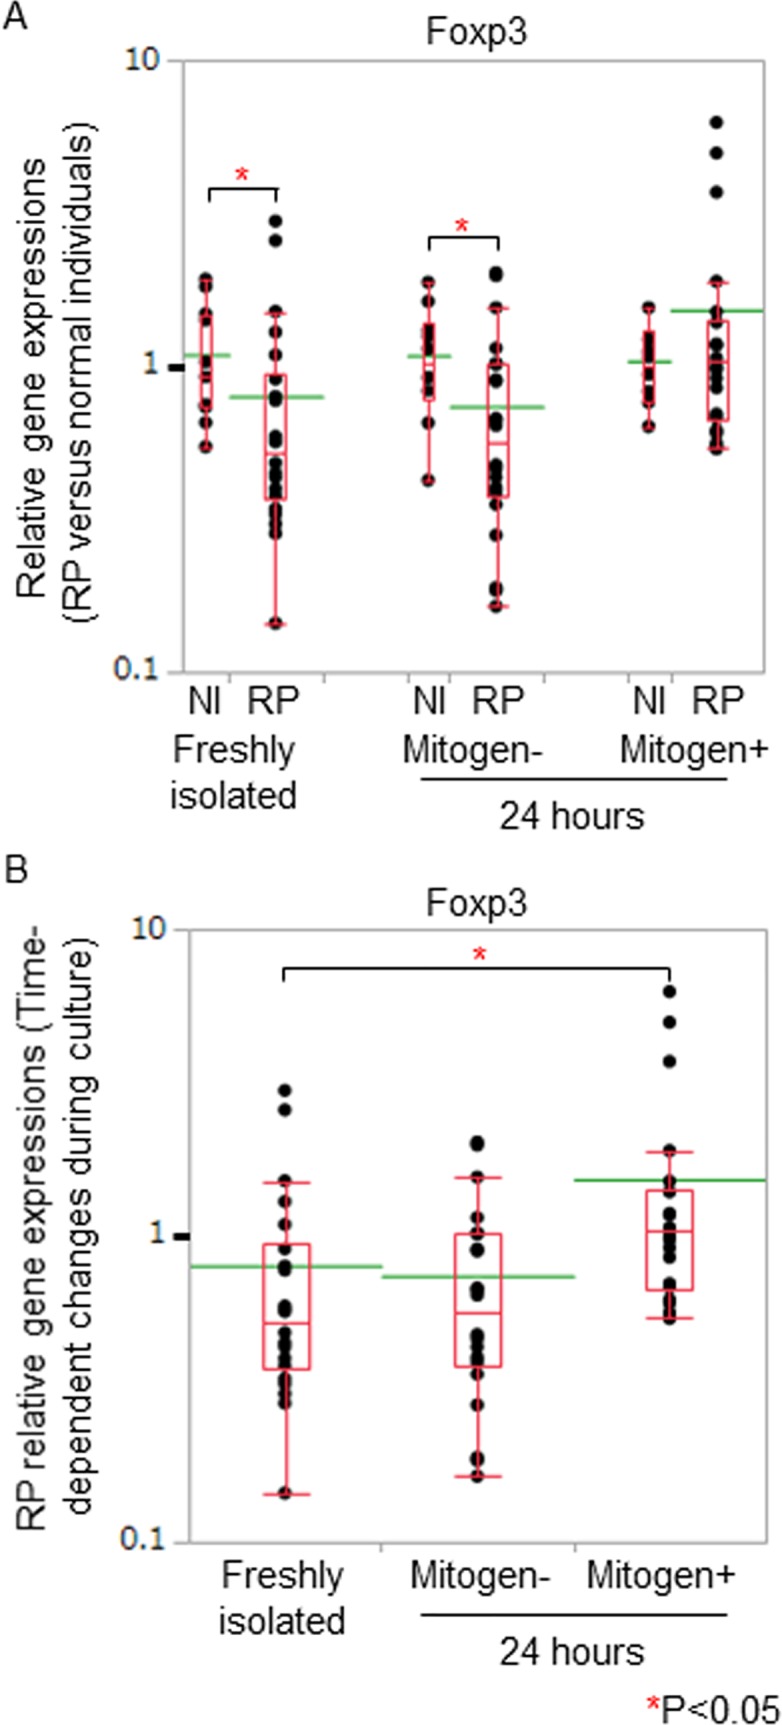
(A) We assessed RP relative gene expressions of Foxp3 by normalizing the titers to 2-ΔΔCt of normal individuals. The gene expression levels of normal individuals were defined as 1.000. Foxp3 gene expressions of RP freshly isolated PBMC were significantly lower than those of normal individuals. (B) We compared the gene expression data of the freshly isolated PBMC with those of cultured PBMC in patients with RP. Foxp3 gene expressions increased significantly in the presence of mitogen stimulation 24 hours after the initiation of the cell culture. Relative gene expressions of RP patients against those of normal individuals were displayed with dot plots. A box-plot and a mean level (green line) of each group of RP patients and normal individuals were indicated.