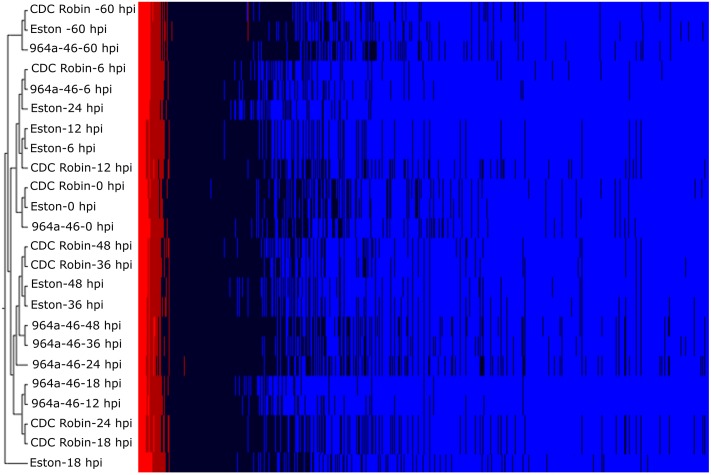
Fig 1. Hierarchical cluster analysis of gene expression profiles of lentil genotypes Eston, CDC Robin and 964a-46 measured at 0 (mock-inoculated control plants sampled before inoculation), 6, 12, 18, 24, 36, 48 and 60 hours post inoculation (hpi) with Ascochyta lentis.
Heat map shows the normalized expression levels of transcripts represented by a color spectrum ranging from red (high expression levels) to blue (low expression levels). The dendrogram shows Pearson’s correlation with an average linkage distance among samples.

