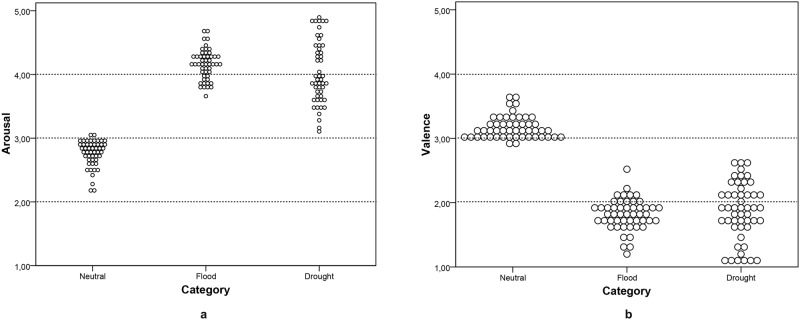
Fig 2. Arousal (a) and valence (b) distribution of outcome ratings for each category.
In the neutral category, the distributions of rating indicated a neutral condition for both affective dimensions. The weather categories were rated with higher arousal and with negative valence, yet the Drought distributions were more spread-out than Flood's. Each dot in the graphic represents a picture.

