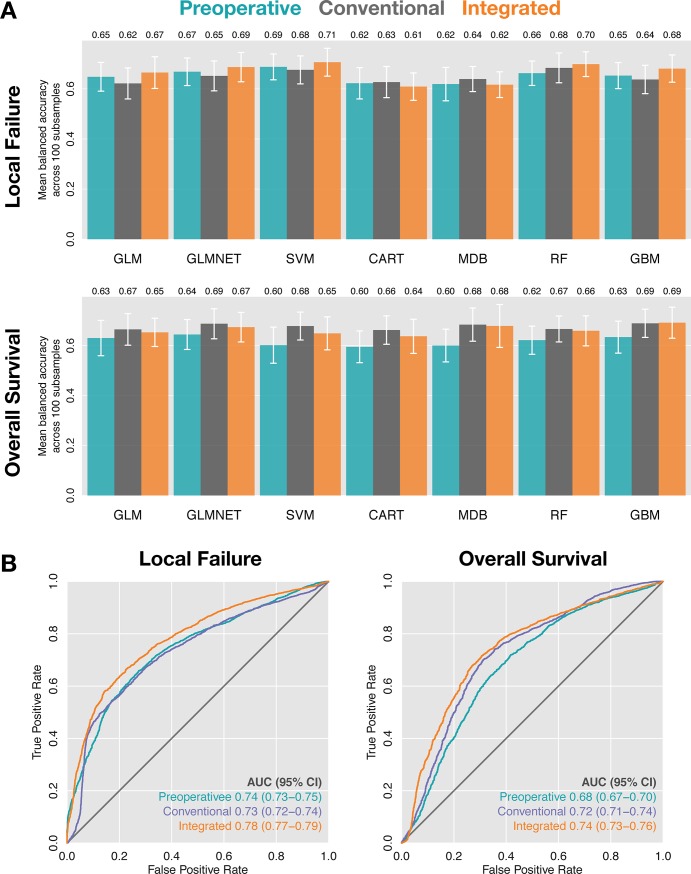
Fig 3. Machine learning model accuracy.
(A) Mean balanced accuracy across 100 subsamples of models predicting local failure (top) and overall survival (bottom). Error bars indicate standard deviation. (B) Receiver-operator characteristic curves for local failure (left) and overall survival (right) for the best preoperative (SVM and GLMNET, respectively), conventional (RF and GLMNET, respectively) and integrated models (SVM and GBM, respectively) as defined in (A). 95% confidence intervals were estimated using 2000 bootstraps. All results are reported on left-out test sets not used for model training.

