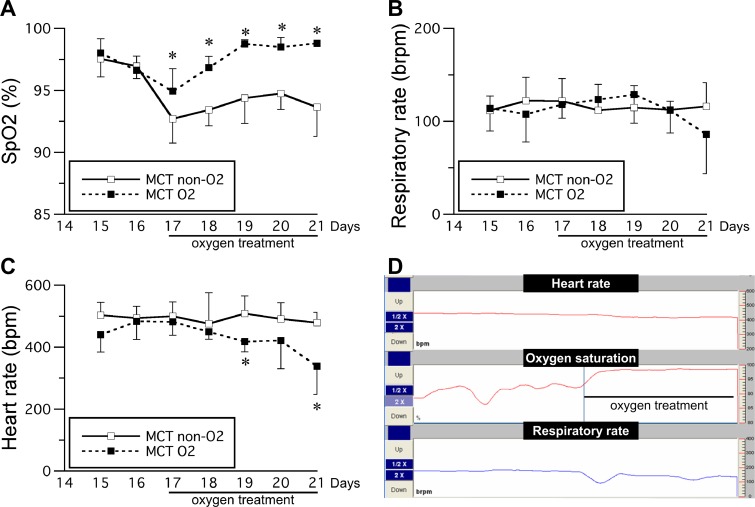
Fig 1.
Time course of changes in oxygen saturation (A), respiratory rate (B), and heart rate (C) after monocrotaline injection and representative data during oxygen therapy (D). Oxygen therapy was initiated 17 days after monocrotaline injection. MCT O2, monocrotaline injection with oxygen therapy (total n = 9; 15–19 days, n = 9; 20 day, n = 7; 21 day, n = 2); MCT non-O2, monocrotaline injection without oxygen therapy (total n = 9; 15–17 days, n = 9; 18–21 days, n = 8). The data are shown as the mean ± standard deviation. *Significantly different from the MCT non-O2 group by independent t-test, p < 0.05.

